The ITU-T G.107 E-model tracks five variables (delay, jitter, packet loss, echo, and codec impairment) to produce a single R-factor that maps directly to MOS score. Philippine enterprise IT teams can build a complete root-cause analysis toolkit around these five inputs using open-source tools and built-in PBX telemetry, with zero external vendor engagement required.
Before Anything: The Baseline You Don’t Have
Every VoIP troubleshooting effort in a Philippine enterprise stalls at the same point: someone reports garbled audio, the IT team opens the switch dashboard, sees green across the board, and files the ticket as “cannot reproduce.” The problem isn’t incompetence. The problem is the absence of a documented network baseline that defines what “normal” looks like for voice traffic on your specific links, at specific times of day, under specific load conditions.
Building that baseline is Phase 1, and it requires synthetic monitoring. Tools like Obkio measure performance from the end-user perspective by sending synthetic traffic every 500 milliseconds, testing latency, jitter, and loss continuously without requiring packet captures. Cisco IP SLA probes do the same on IOS-based switches and routers already deployed in most Philippine enterprise networks. If your infrastructure runs Yeastar P-Series or Asterisk-based PBXs, you can configure periodic SIP OPTIONS pings between endpoints to track round-trip times across each network segment.
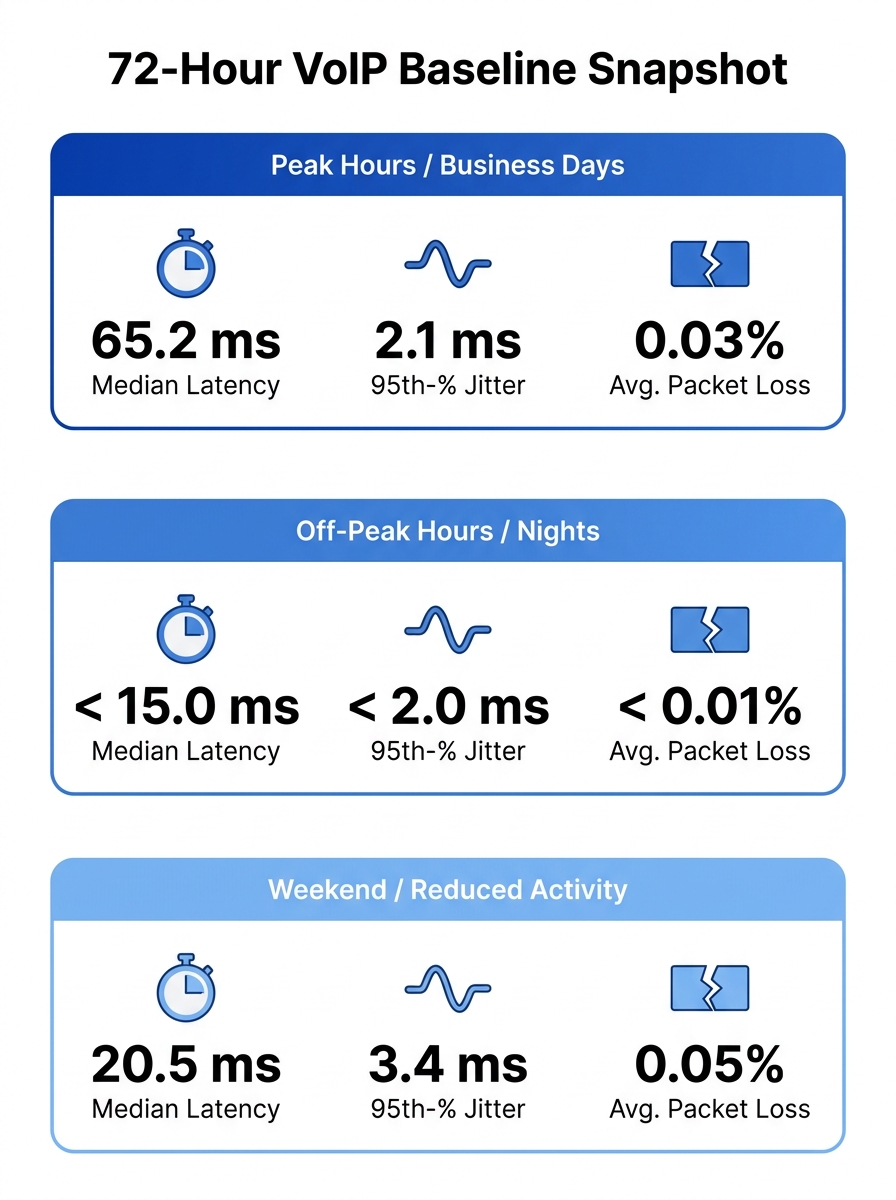
The goal is 72 hours of continuous measurement during a normal business week. Capture readings during the 8 AM to 6 PM window when BPO shifts overlap, during the lunch-hour lull, and during off-peak hours. You need three numbers from this exercise: your median one-way latency, your 95th-percentile jitter, and your average packet loss rate per trunk. Those three numbers become the reference point against which every future complaint gets measured.
If you’ve already built QoS policies for voice traffic prioritization, your baseline readings should reflect those policies in action. If they don’t, QoS isn’t applied where you think it is.
Instrumenting the Four VoIP Call Quality Metrics That Separate Signal from Noise
With a baseline in hand, you need persistent instrumentation of four VoIP call quality metrics: MOS score, packet loss percentage, jitter (packet delay variation), and one-way latency. Each tells you something different about what’s degrading the call, and each points to a different layer of the network stack.
MOS score (Mean Opinion Score) is the summary metric. A score of 4.0 or above on the ITU-T P.800 scale means users perceive “good” quality. Between 3.5 and 4.0, quality is acceptable but noticeable degradation exists. Below 3.0, calls are functionally unusable. MOS score monitoring through tools like Obkio’s MOS monitoring or VoIPmonitor (which tracks MOS alongside R-factor per RTP stream) gives you the top-level view. But MOS alone never tells you why quality dropped.
Packet loss above 1% on a voice RTP stream produces audible gaps and clipping. At 3%, most codecs can’t compensate, and the call sounds like it’s cutting in and out. Packet loss diagnosis requires per-interface and per-VLAN measurement, because aggregate switch statistics hide the problem. A port running 0.02% loss overall can still spike to 5% loss during a 30-second burst when a backup job saturates the uplink.
Jitter (packet delay variation, or PDV) above 30 milliseconds causes the receiving endpoint’s jitter buffer to overflow or underrun, producing choppy audio. Network jitter measurement needs to happen at both the access layer and the WAN edge. Philippine enterprises running SD-WAN overlays for multi-site VoIP should measure jitter independently on the underlay and overlay paths, since SD-WAN’s own jitter buffering can mask problems that reappear under load.
One-way latency above 150 milliseconds (ITU-T G.114 recommendation) produces talk-over effects where both parties speak simultaneously because they can’t perceive the delay fast enough to take conversational turns. For Philippine enterprises with SIP trunks terminating at carrier gateways in Metro Manila, one-way latency to Visayas and Mindanao branch offices routinely hits 80-120 ms even on fiber, leaving almost no headroom.
| Metric | Acceptable Threshold | Degraded | Unusable | Primary Diagnostic Target |
|---|---|---|---|---|
| MOS Score | ≥ 4.0 | 3.0–3.9 | < 3.0 | Overall quality summary |
| Packet Loss | < 1% | 1–3% | > 3% | Interface errors, congestion |
| Jitter (PDV) | < 30 ms | 30–50 ms | > 50 ms | Buffer sizing, QoS queuing |
| One-way Latency | < 150 ms | 150–250 ms | > 250 ms | Path selection, codec choice |
When Packet Loss Diagnosis Pointed Away from the ISP
Here’s where Philippine enterprise troubleshooting typically goes sideways. A team sees packet loss on voice traffic, opens a ticket with PLDT or Globe or Converge, and waits three to five business days for the carrier to respond with “no issues found on our side.” The carrier is often correct. Internal research and industry monitoring data consistently show that the majority of packet loss affecting VoIP calls in enterprise environments originates inside the building, not on the ISP’s backbone.
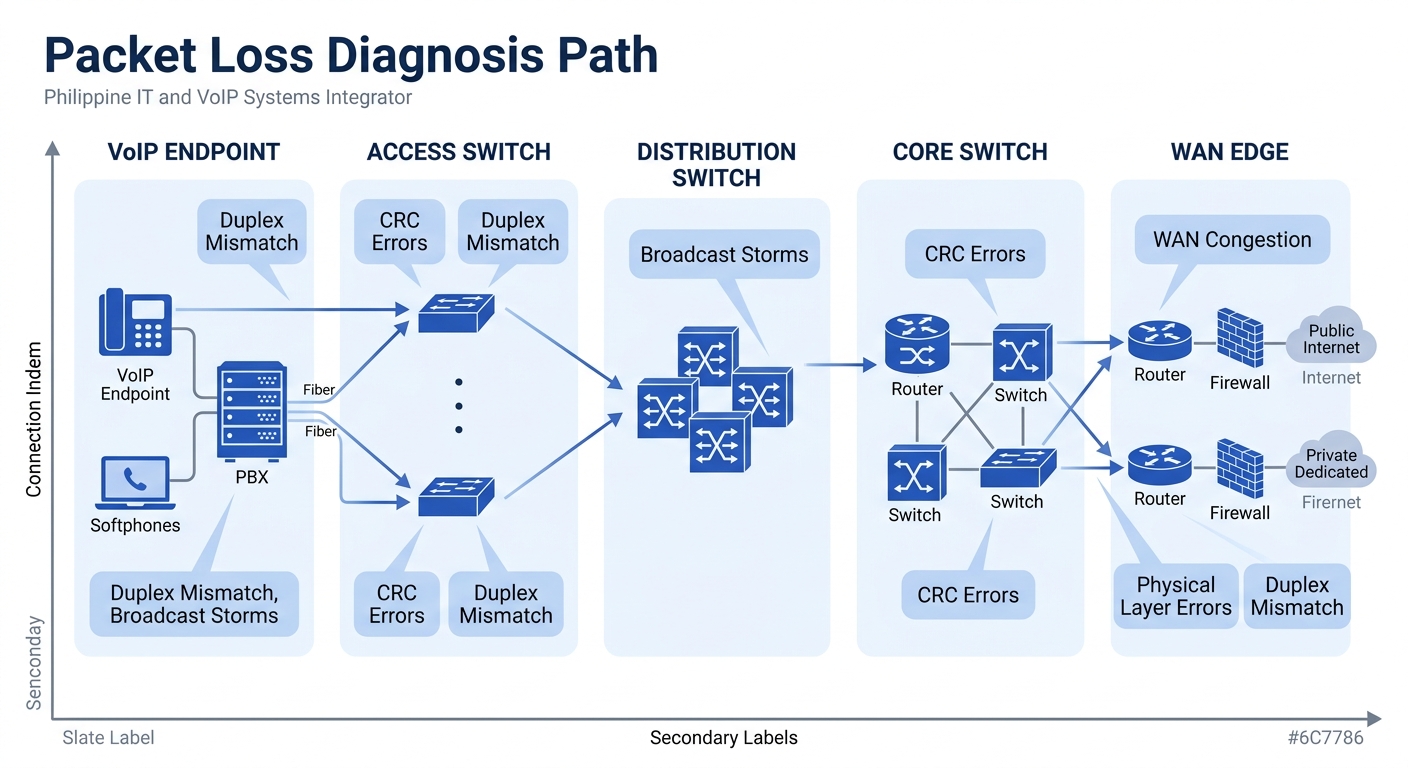
The typical culprits for Philippine offices: CRC errors on aging Cat5e patch cables (especially in buildings where cabling hasn’t been touched since initial fitout), duplex mismatches on access switch ports connected to IP phones, and broadcast storms from flat VLANs where voice and data traffic share the same Layer 2 domain. One Philippine BPO documented a case where rebuilding its structured cabling infrastructure eliminated 40% of recurring network incidents, and the root cause was never the switches, the ISP, or the PBX.
Packet loss diagnosis follows a specific path: start at the endpoint (phone or softclient), check the RTP stream statistics in the phone’s own web interface (Fanvil, Yealink, and Poly endpoints all expose per-call jitter and loss counters), then trace upstream to the access switch port, the distribution switch, the core, and finally the WAN edge. If loss appears on the phone but the access switch port shows clean counters, the cable between them is your suspect. If the access switch shows loss but the distribution layer doesn’t, the uplink between those two layers is congested or erroring.
James Ott Jr., Communications System Technician and IT Administrator, described the diagnostic value of persistent monitoring: “PRTG allows us to see the health and performance of the network. Using these measurements we can make decisions on how to repair a piece of equipment before it fails and causes a service interruption.”
The Jitter Spike That Showed Up at 2 PM Every Day
Network jitter measurement produces its most valuable findings when correlated with time. Steady-state jitter is rarely the problem; the problem is jitter spikes that coincide with specific network events.
A recurring pattern in Philippine enterprises: jitter on voice VLANs spikes every day at the same time, and the spike correlates with a scheduled process. Backup jobs running over the production network at 2 PM. Antivirus definition pushes hitting 500 endpoints simultaneously. Cloud sync operations for a SaaS application saturating the internet uplink. The voice packets don’t get dropped, but they get delayed unevenly as they wait behind large data transfers in the switch’s egress queues.
This is where QoS configuration earns its keep. DSCP marking (EF/46 for voice RTP, CS3 for SIP signaling) combined with strict priority queuing on every switch hop ensures voice packets exit first regardless of competing traffic. But QoS only works when it’s applied consistently on every device in the path. A single unmanaged switch inserted by a facilities team for a conference room will strip DSCP markings and requeue voice packets as best-effort.
Warning: Unmanaged switches in the voice path are invisible to most monitoring tools. A quarterly physical audit of every patch panel and IDF closet catches these before they cause intermittent jitter spikes that consume weeks of troubleshooting time.
If you’re running packet capture analysis on your SIP trunks, add a Wireshark display filter for RTP stream analysis. The “Telephony > RTP Streams” view gives you per-call jitter and loss numbers, and you can correlate timestamps with your baseline data to identify whether the jitter event is localized or network-wide.
For enterprises using ITU Y.1731 performance monitoring on their carrier Ethernet circuits, double-endpoint testing provides precise jitter measurement between two known points, isolating the WAN segment from internal issues.
Correlating Complaints with Dashboard Data
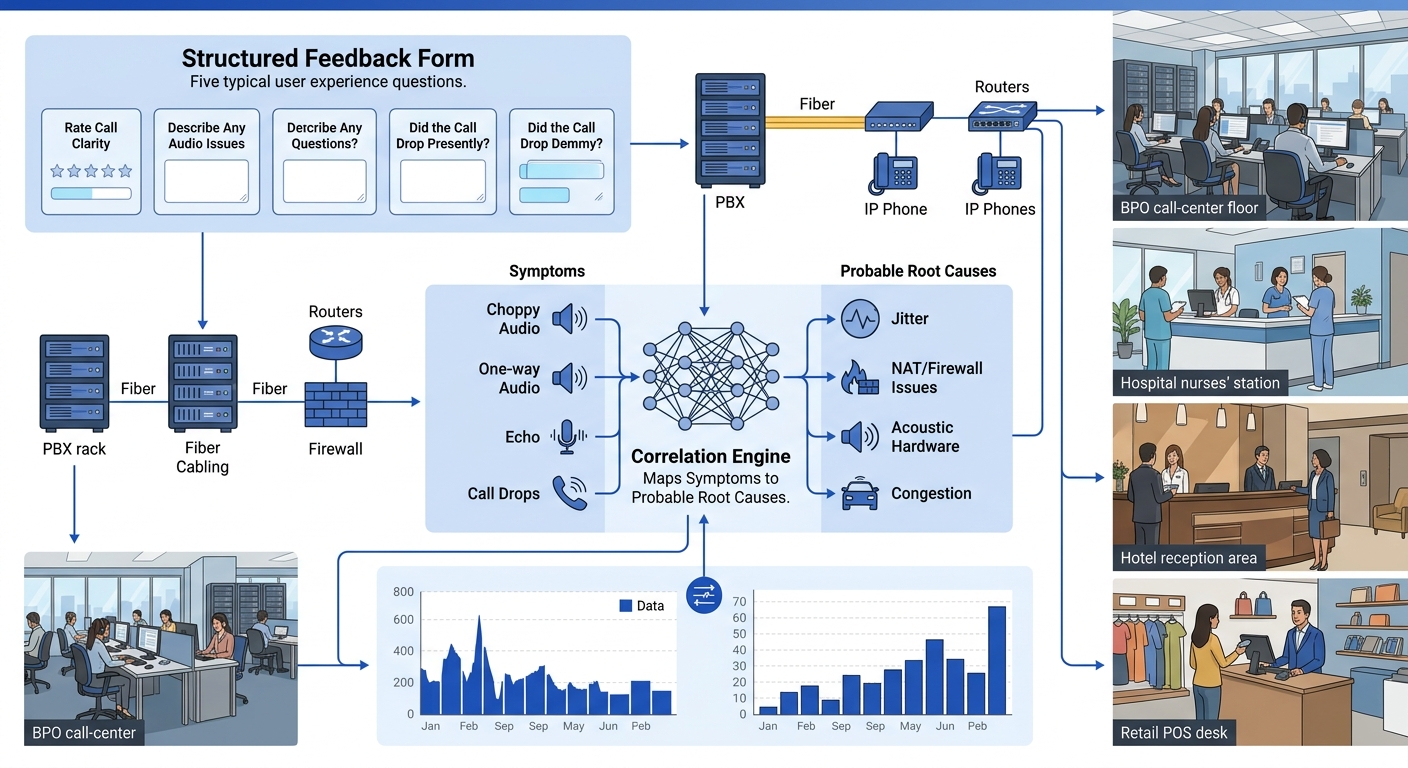
The single highest-value step in this entire process has nothing to do with network equipment. It’s replacing the free-text “describe your issue” field in your helpdesk system with a structured five-question form that converts subjective user complaints into queryable data.
The five fields: (1) when the problem occurred, with 15-minute granularity, (2) call type (inbound, outbound, internal extension-to-extension), (3) specific symptom from a dropdown (choppy audio, one-way audio, echo, call drops, delayed audio), (4) device used (desk phone model, softclient, headset model), (5) frequency (every call, intermittent, specific times only). This structured feedback transforms Philippine enterprise troubleshooting from reactive ticket-chasing into pattern analysis.
A MOS score above 4.0 at the SIP gateway can coexist with garbled audio at the desk because automated tools often measure at the trunk level, missing degradation on the last 30 meters of LAN or Wi-Fi.
Symptom-to-cause mapping becomes deterministic with enough structured data points. Choppy audio clusters on a specific floor during specific hours points to jitter or packet loss on that floor’s access switch uplink. One-way audio reports concentrated on outbound calls through a specific SIP trunk point to NAT traversal or firewall issues with RTP stream pinholing, a problem we’ve covered in detail when discussing how WebRTC handles NAT traversal in enterprise UC platforms. Echo complaints tied to a specific headset model point to acoustic echo cancellation failures in the hardware, not the network at all.
As D&V Philippines notes in their analysis of root cause methodology, “by addressing the root cause of a problem, you can stop such occurrences from happening again. And by knowing why such problems emerge, you can create better risk mitigation strategies.”
Where This Lands for Philippine IT Teams Now
Philippine enterprises running 50 to 2,000 VoIP endpoints have enough tooling available today to build a complete internal root-cause analysis capability. The toolkit isn’t a single product purchase. It’s a layered approach: synthetic monitoring for baselines, per-call RTP statistics from endpoint web interfaces, switch-level interface error counters, and structured user feedback forms that make complaint data as precise as telemetry data.
The specific challenge in the Philippine market remains ISP variability. Converge’s planned deployment of nearly 1 million new fiber ports across provincial areas will improve last-mile quality for branch offices, but internal network issues will still account for the majority of VoIP quality problems. Clean ISP circuits deliver packets to your building’s demarcation point. Everything that happens to those packets after that point is your responsibility, your visibility gap, and your problem to solve.
The teams that build this toolkit systematically, starting with baselines, instrumenting the four core metrics, mapping packet loss to specific network layers, correlating jitter with scheduled events, and converting user complaints into structured data, will stop calling their SIP trunk provider every time someone reports choppy audio. They’ll know where the fault lies before they pick up the phone. And when the fault genuinely is on the carrier’s side, they’ll have the timestamped, per-call evidence to prove it.