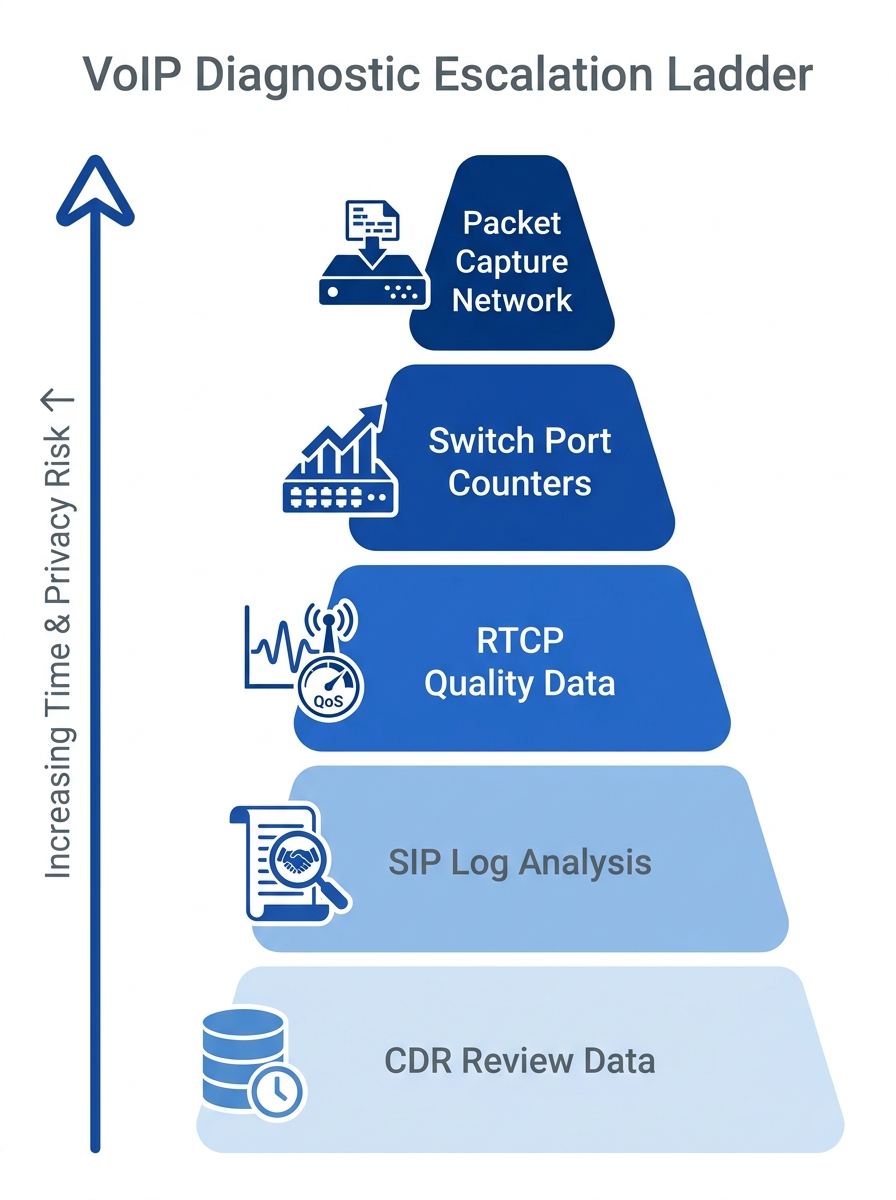
A structured VoIP packet capture analysis toolkit for Philippine enterprises requires five layers: SIP signaling logs, RTP quality measurement, synthetic test probes, switch-port diagnostics, and a data privacy protocol for PCAP files. System logs and CDRs resolve roughly 90% of call quality problems without deep packet inspection ever touching the wire.
TL;DR: Build your diagnostic workflow around SIP logs and RTCP data first, packet captures second. Track MOS, jitter, packet loss, and delay on every call. Run synthetic probes at fixed intervals. Treat switch-port counters as frontline diagnostic instruments. And never transmit an unencrypted PCAP file across any Philippine enterprise network.
SIP call signaling debugging and enterprise call flow inspection sound like specialized skills reserved for network engineers at Cisco TAC. They’re not. Any Philippine IT team running voice over IP across two or more offices can build a repeatable diagnostic process with free and low-cost tools, a handful of rules, and a clear escalation ladder that keeps packet captures as a last resort rather than a first instinct. These six rules form that process.
Exhaust SIP logs and CDRs before opening Wireshark
Packet captures are expensive in time, storage, and privacy risk. SIP system logs and Call Detail Records answer the diagnostic question faster in the overwhelming majority of cases. A SIP 408 Request Timeout error in your logs points directly to a registration failure or trunk timeout. A 503 Service Unavailable response identifies trunk capacity exhaustion. A 488 Not Acceptable Here reveals codec mismatch between endpoints. Each of these takes seconds to spot in a log file and hours to reconstruct from a raw packet trace.
Cisco’s VoIP troubleshooting documentation outlines a step-by-step diagnostic sequence that begins with dial-peer verification and codec negotiation checks before touching any packet-level data. The command debug cch323 rtp, documented in Cisco’s CUCM Release 12.5(1) troubleshooting guide, displays uppercase characters (X for transmitted, R for received) when packets move successfully and lowercase when they drop. That single letter distinction tells you whether the problem is network transport or endpoint configuration.
If you’ve already built network logging practices for your VoIP environment, you have the foundation. CDRs give you call duration, termination cause codes, and trunk utilization percentages. RTCP reports embedded in most enterprise phone systems provide jitter, loss, and estimated MOS without any capture tool running at all.
Tip: Configure your PBX to retain SIP debug logs for a minimum of 7 days. Yeastar P-Series stores logs locally; Cisco CUCM pushes them to syslog servers. Either way, you need the data available when the complaint arrives — which is always after the call ended.
Capture at both call endpoints simultaneously
When packet traces become necessary, a single-point capture is almost useless for VoIP. SIP signaling and RTP media streams travel different network paths, cross different firewall rules, and hit different QoS policies at each hop. A capture at the caller’s switch port may show clean RTP transmission while the receiver’s side reveals 4.2% packet loss caused by a congested WAN link between your Makati and Cebu offices.
The VoIP-info.org debugging reference documents several tools purpose-built for dual-endpoint SIP call signaling debugging. PacketIsland’s micro-appliances capture SIP traffic inline and generate ladder diagrams from thousands of calls stored over weeks. SIP Workbench provides a graphical protocol analyzer that correlates SIP, RTP, STUN, and TURN interactions across multiple network points.
For Cisco VoIP troubleshooting tools specifically, the debug cch323 rtp output at both ends lets you compare transmit and receive patterns. If Site A shows all uppercase X characters (successful transmissions) but Site B shows lowercase r characters (dropped receptions), the loss is occurring in transit, likely at a WAN boundary or ISP interconnection point. In the Philippines, traffic between Globe and PLDT networks often crosses peering points that neither provider monitors aggressively, making dual-endpoint captures essential for isolating where degradation actually occurs.
Track four RTP quality metrics on every call
RTP quality metrics are the quantitative backbone of any VoIP diagnostic toolkit. VoIPmonitor, an open-source monitoring platform for Linux, calculates MOS using the ITU-T G.107 E-model on a 1–5 scale and generates interactive 2D and 3D reports across four key dimensions: MOS, jitter, packet loss percentage, and PDV (Packet Delay Variation).
The ITU-T benchmarks are specific and non-negotiable for toll-quality voice:
| Metric | Threshold | Standard | Impact When Exceeded |
|---|---|---|---|
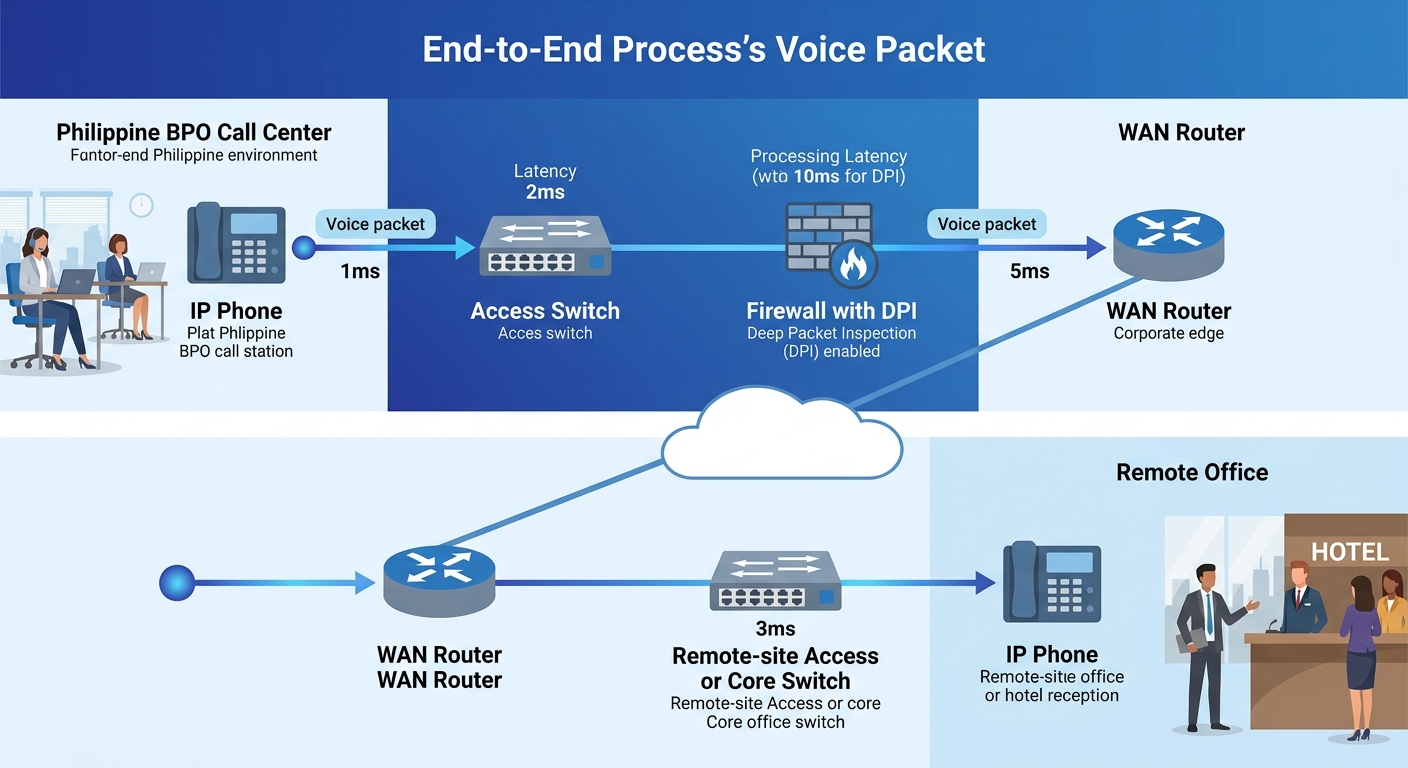
| One-way latency | ≤150 ms | ITU-T G.114 | Speakers talk over each other |
| Jitter | ≤30 ms | Industry standard | Audio distortion, robotic voice |
| Packet loss | ≤1% for G.711 | Industry standard | Audible gaps, dropped syllables |
| MOS | ≥4.0 | ITU-T G.107 | User complaints begin below 3.5 |
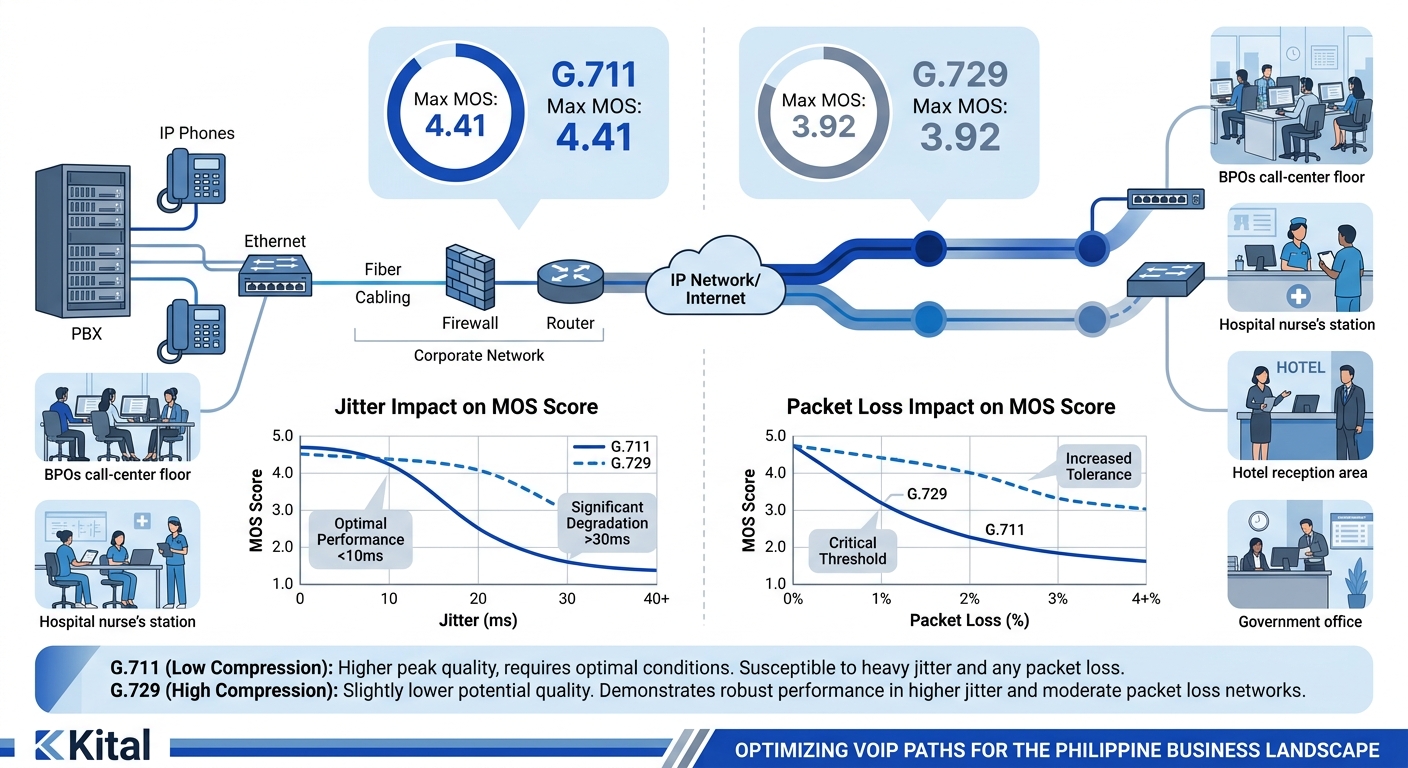
Codec choice constrains your maximum achievable MOS. G.711 carries a theoretical ceiling of 4.41, while G.729 tops out at 3.92 even under perfect network conditions. Mixed environments common in Philippine mid-market deployments, where you might run Yeastar IP phones on G.711 alongside Cisco endpoints on G.729, need a monitoring tool that normalizes these different baselines into a single view.
A MOS score of 4.1 measured on a quiet Saturday tells you nothing about Monday morning at 9 AM when 200 BPO agents hit their trunks simultaneously.
Newer Cisco 8800 and 9800 series phones report Concealment Ratios instead of traditional MOS. A Severely Concealed Seconds Ratio above 3% indicates audible degradation that users will notice and complain about. If you’re diagnosing call quality degradation across your infrastructure, your toolkit needs to ingest both MOS and concealment data.
RFC 6792, authored by Q. Wu (Huawei), G. Hunt, and P. Arden (BT) and published in November 2012, established the RTP monitoring framework that extended RTCP with new Extended Reports block types for media quality metrics. This framework underpins how modern VoIP monitoring tools collect and report the four metrics above.
Run synthetic test calls at fixed intervals during business hours
ThousandEyes’ engineering team described the rationale clearly in their enterprise WAN monitoring guide: “By replicating RTP flows with active tests that probe the network in regular intervals, we build a continual baseline of performance.” Without that baseline, every metric is ambiguous. A jitter measurement of 22 ms means nothing if you don’t know whether your network typically runs at 8 ms or 35 ms.
Synthetic probes scheduled every 5–15 minutes during business hours generate test calls that measure latency, jitter, loss, and MOS independent of actual user traffic. Cisco IP SLA probes, Yeastar’s built-in SIP OPTIONS monitoring, and tools like Obkio all generate this baseline data. For Philippine enterprises with offices in Metro Manila, Cebu, and Davao connected over MPLS or SD-WAN, these probes catch degradation at ISP handoff points before any user picks up the phone.
The VoIP performance validation cycle formalizes this into four stages: measure, compare against baseline, adjust QoS or routing, then re-measure to confirm resolution. Philippine BPO call centers running 500+ concurrent SIP sessions need this cycle running continuously. A single failed probe at 9:15 AM that shows jitter spiking from 12 ms to 47 ms gives your team a 15-minute head start on a problem that would otherwise surface as 50 agent complaints by 9:30 AM.
Warning: A common mistake: running synthetic probes only during off-hours “to avoid impacting production.” This produces a baseline that reflects your network at its quietest and most misleading state. Probe during peak hours or the data is worthless.
Treat your switch ports as diagnostic instruments
Switch-level metrics are the most overlooked layer in VoIP packet capture analysis. Before you reach for Wireshark, check the interface counters on the access switch port where the affected phone connects. CRC errors, runts, giants, and input errors on a Cisco Catalyst or Fortinet FortiSwitch port indicate Layer 1 or Layer 2 problems that no amount of SIP debugging will reveal.
A port accumulating 200+ CRC errors per hour will produce intermittent packet loss that degrades MOS unpredictably. The symptom looks like a network congestion problem, but the cause is a bad cable, a failing PoE injector, or a damaged RJ45 connector. Replacing a P150 patch cable solves a problem that could otherwise consume days of packet trace analysis.
Spanning Tree Protocol topology changes are another switch-level diagnostic signal. Each STP reconvergence event causes 1–3 seconds of traffic disruption on the affected VLAN. If your voice VLAN shows frequent topology changes in the switch logs, you have a flapping uplink, a misconfigured trunk, or a rogue device triggering reconfigurations. Those 1–3 second interruptions manifest as silence mid-call, which users describe as “the call dropped for a second.” Your SIP protocol traces won’t show anything because SIP signaling remained intact while the media path went dark.
And don’t overlook firewall impact. Deep packet inspection on Fortinet FortiGate or Cisco Firepower firewalls adds 5–20 ms of latency per hop when applied to RTP streams. Voice VLANs should bypass application-layer inspection entirely and use network-layer ACLs instead. If your total voice path crosses 3 firewalls doing DPI, you’ve added up to 60 ms of latency before the WAN even enters the picture.
Never transmit a PCAP file unencrypted
Full RTP packet captures contain decodable audio. Wireshark can reconstruct and play back voice conversations from a PCAP file in under 30 seconds. Under the Philippines’ Data Privacy Act of 2012 (Republic Act 10173), an unsecured PCAP file containing voice data from a healthcare provider, bank, or government agency constitutes a processing violation if it exposes protected information.
The National Privacy Commission treats unencrypted voice captures the same way it treats unencrypted patient records or financial data. The practical rules are straightforward: store PCAP files only on encrypted volumes, restrict access to authorized diagnostic personnel, delete captures within 72 hours of resolving the issue, and never send a PCAP file over email or unencrypted file transfer. If your diagnostic workflow requires sharing captures between sites, use SFTP or an encrypted collaboration channel.
This is especially relevant for Philippine enterprises that recently experienced data breach incidents at scale. Your VoIP diagnostic files are an attack surface. A PCAP file from a BPO call center handling financial services calls contains account numbers, verification data, and full audio of customer interactions. Treat the file accordingly.
When These Rules Break Down
These six rules assume a controlled enterprise network where you own or manage the switches, firewalls, and WAN links. They break down in three scenarios common to Philippine deployments.
First, home-based agents on consumer-grade internet. When your BPO staff works from residential PLDT or Globe connections, you can’t access switch-port counters or run SPAN captures. Lightweight agents from tools like Obkio or NetBeez installed on the agent’s workstation become your only diagnostic endpoint. Synthetic probes still work, but switch-level rules don’t apply.
Second, hosted PBX or UCaaS environments where you don’t control the SIP trunk termination. If your provider handles the SBC and trunk, your visibility starts and ends at your network edge. The SIP logs live on their servers. Push your provider for RTCP-XR data sharing per RFC 6792, or you’re diagnosing blind.
Third, encrypted SIP/TLS with SRTP where you can’t read the signaling or media payloads in a standard capture. You’ll need the server’s private key loaded into Wireshark to decrypt TLS-wrapped SIP, and SRTP key exchange details (typically SDES) to decode media streams. If your security policy prohibits sharing private keys with diagnostic staff, you’re limited to metadata analysis: packet sizes, timing, and flow patterns rather than payload content.
Every rule here has an exception. The discipline is knowing when you’ve crossed from the rule’s territory into the exception’s, and adjusting your toolkit before you waste three hours staring at encrypted packets you can’t read.