MOS 4.1, jitter at 12 milliseconds, zero packet loss. That’s the scorecard a Philippine hospital IT team presented after commissioning their new Yeastar S300 PBX. The measurements came from a single afternoon of testing on a Saturday, when the radiology department’s PACS system was idle and nobody was streaming training videos over the same VLAN. The scores looked excellent. They were also useless as a predictor of Monday morning call quality.
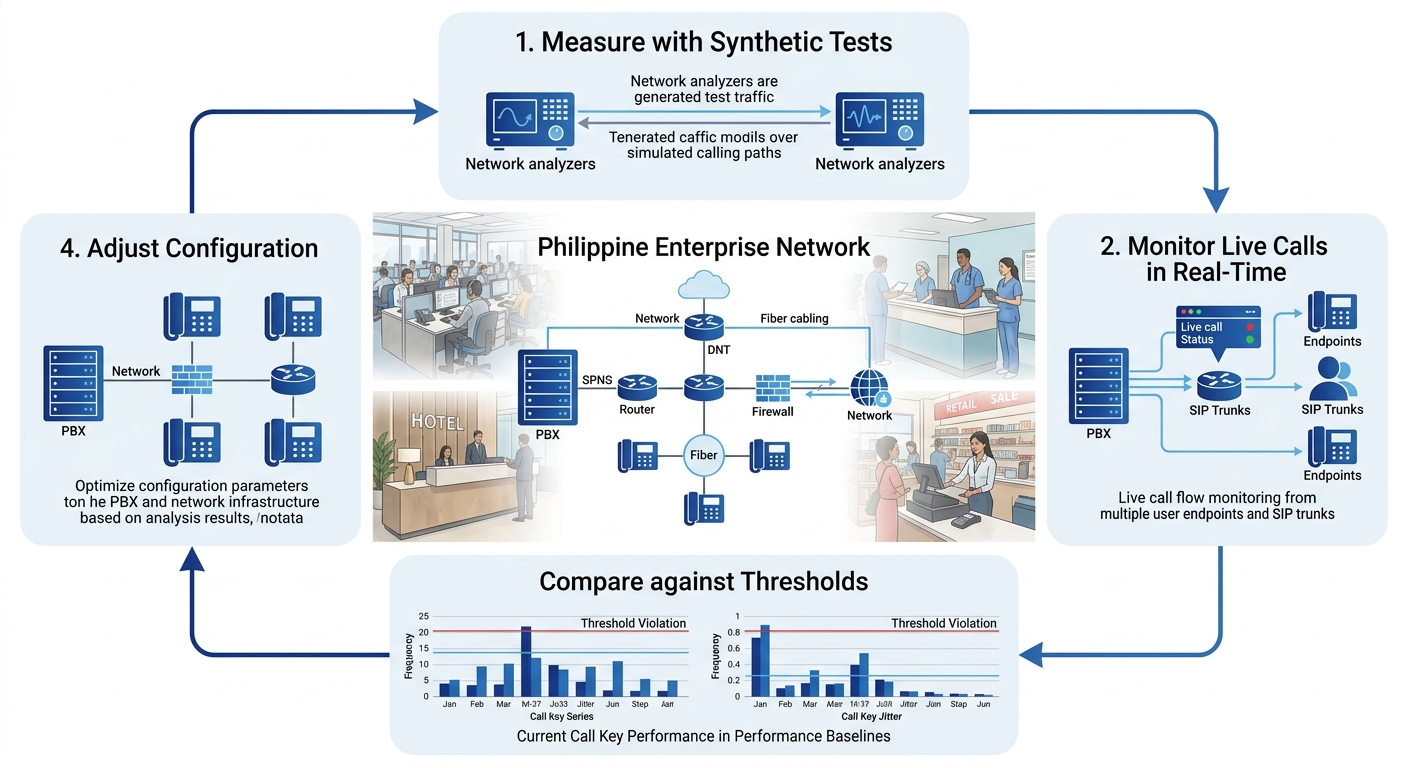
The misunderstanding here is foundational: treating VoIP quality measurement as a one-time commissioning task rather than a continuous cycle. A VoIP benchmarking framework that measures once and files the results away will miss the degradation that creeps in over weeks, the congestion patterns that only appear during peak hours, and the ISP routing changes that happen without warning. The mechanism that actually keeps enterprise VoIP reliable is a closed loop of measurement, comparison, adjustment, and re-measurement. Each stage feeds the next, and skipping any of them means you’re flying on instruments that went dark months ago.
How a Single Measurement Misleads
A point-in-time measurement captures the state of your network at one moment under one set of conditions. Voice traffic is sensitive to conditions that fluctuate wildly throughout a business day: WAN utilization, the number of active calls, backup jobs consuming bandwidth, even the behavior of other tenants on shared internet links.
A Makati BPO floor running 40 concurrent calls at 8 AM might see perfect metrics. By 10 AM, when the call volume doubles and the building’s shared fiber uplink starts competing with a neighboring tenant’s cloud backup window, jitter spikes to 40 ms and agents hear choppy audio. If you benchmarked at 8 AM, your records show everything is fine. Your agents know otherwise. We’ve explored this exact phenomenon in our writeup on hidden network bottlenecks that kill VoIP quality, where properly configured QoS still fails to prevent degradation because the bottleneck sits somewhere QoS policies don’t reach.
The validation cycle exists to close this gap. It replaces the snapshot with a film, capturing performance across hours, days, and weeks so you can distinguish a one-off anomaly from a systemic trend.
The Four Metrics That Define Call Quality Thresholds
Before you can build a continuous performance validation loop, you need to know what you’re measuring. Four network performance metrics form the foundation of every VoIP quality assessment.
Latency is the time a voice packet takes to travel from sender to receiver. The ITU-T G.114 recommendation sets the acceptable one-way delay at 150 ms or less for conversational speech. Once you cross that threshold, speakers start talking over each other because the delay creates unnatural pauses. According to AVOXI’s VoIP QoS guide, latency beyond 150 ms round-trip is often the hardest degradation to pinpoint without active monitoring because users describe it as “the call feels weird” rather than identifying a specific technical symptom.
Jitter measures the variation in packet arrival times. Your jitter buffer absorbs some of this variation, but once jitter exceeds 30 ms consistently, even a well-tuned buffer starts discarding packets or introducing additional delay to compensate. Either outcome hurts perceived quality.
Packet loss is the percentage of voice packets that never arrive. G.711 codec calls become noticeably degraded at just 1% packet loss. With G.729, which compresses audio more aggressively, the tolerance is even lower because each lost packet represents a larger chunk of audio data.
Mean Opinion Score (MOS) rolls latency, jitter, and packet loss into a single number on a 1-to-5 scale. A MOS of 4.0 or above indicates toll-quality voice. Below 3.5, and your users will start complaining. MOS can be measured subjectively (asking humans to rate call quality) or estimated algorithmically using the E-model defined in ITU-T G.107.
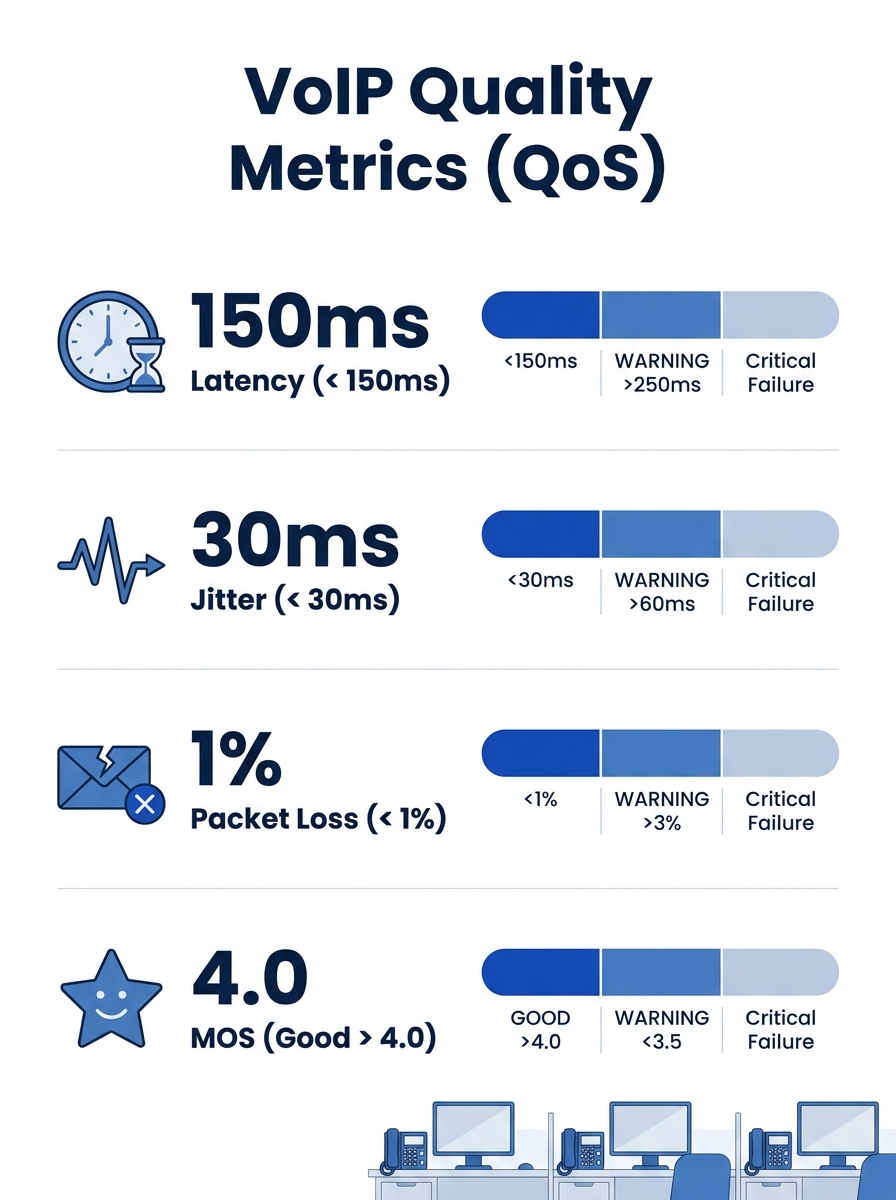
These four metrics together define your call quality thresholds. Every measurement in your validation cycle gets compared against them. The thresholds themselves aren’t universal, though. A government agency handling citizen inquiries might tolerate slightly higher latency than a contact-center technology operation for Philippine BPOs where agents are on back-to-back calls for eight hours and even minor quality dips trigger handle-time increases.
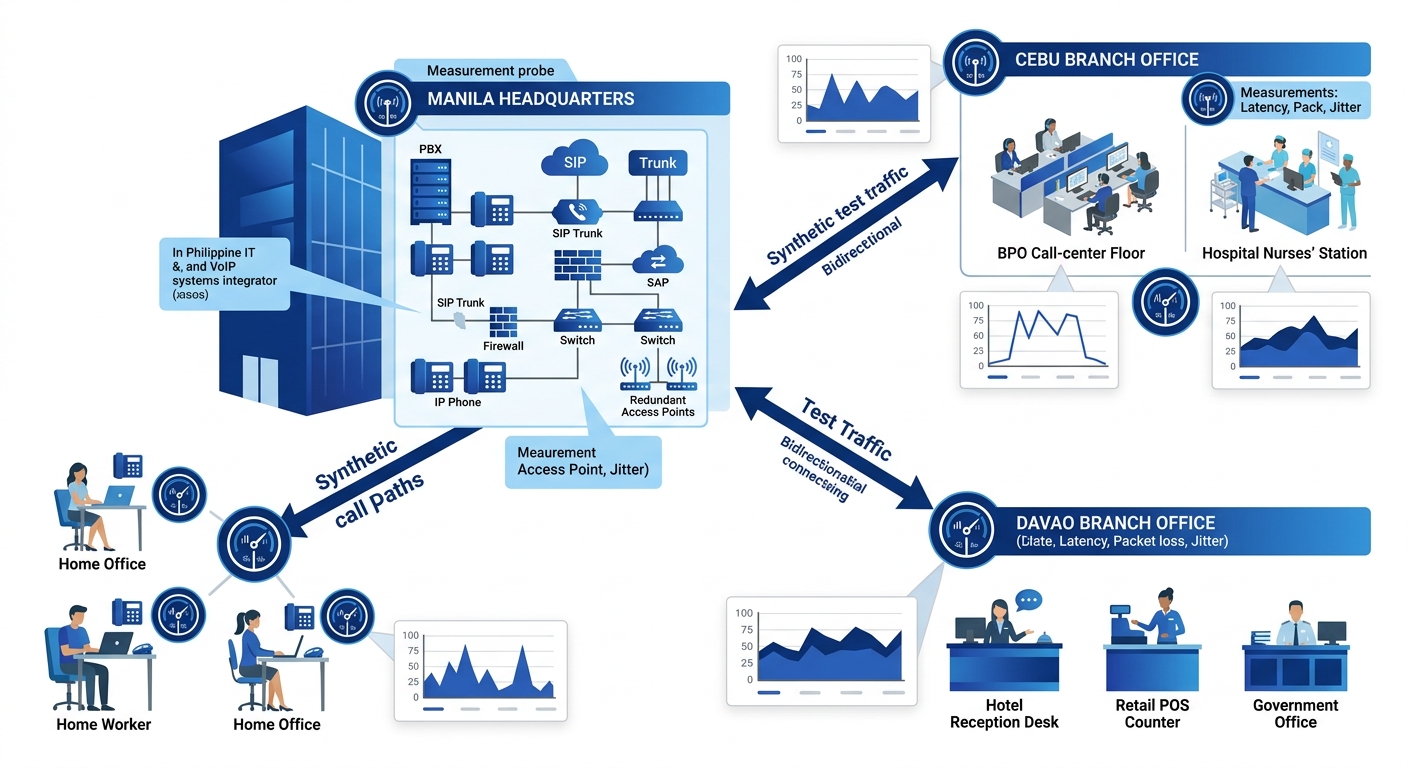
Synthetic Test Calls as the Baseline Engine
The first active layer of the validation cycle uses synthetic test calls to generate measurement data on a schedule, independent of actual user traffic. Think of these as heartbeat signals: your system places test calls between endpoints at regular intervals and records the resulting latency, jitter, packet loss, and MOS for each one.
As ECG’s call quality monitoring guide puts it, synthetic test calls are valuable for pinpointing recurring problems without waiting for user complaints. You can compare performance across office locations, remote worker VPNs, and ISP connections to isolate the source of disruptions before anyone picks up a phone and notices something wrong.
For Philippine enterprises with multiple sites, this comparison capability matters enormously. A synthetic call from your Makati headquarters to a Davao branch office traverses a completely different network path than one to your Cebu BPO floor. Running synthetic tests across all paths simultaneously reveals which links are weakest and when they degrade. Yeastar PBX systems support SIP OPTIONS keepalives that serve a similar function for trunk monitoring, and Cisco IP SLA probes can generate synthetic voice traffic on compatible routers.
Tip: Schedule synthetic test calls to run every 5 to 15 minutes during business hours and every 30 minutes off-peak. This gives you enough granularity to catch degradation patterns that correlate with specific times of day without flooding your network with test traffic.
The key engineering decision is where to place your test endpoints. At minimum, you want a test agent at every site that handles voice traffic. If your BPO operation uses remote agents working from home on consumer ISP connections, you’ll need lightweight software agents on their workstations too, since their last-mile link is almost always the weakest segment.
The Real-Time Monitoring Layer
Synthetic calls tell you what the network can do. Real-time monitoring of actual calls tells you what the network is doing. Both are necessary because synthetic tests run on a schedule and might miss a 90-second congestion spike that ruins a dozen real calls.
Real-time monitoring tools like SolarWinds VoIP Network Quality Manager (VNQM) or Obkio’s network monitoring agents capture metrics from live call streams. VNQM, for instance, provides a top-down view of call records that lets you correlate call quality degradation with WAN performance data and discover IP SLA-capable nodes across your infrastructure. Obkio’s approach maps the complete network path from agent location through their ISP to your data center, overlaying performance data on every hop so you can see exactly where degradation occurs.
The validation cycle replaces the snapshot with a film, capturing performance across hours, days, and weeks so you can distinguish a one-off anomaly from a systemic trend.
For Philippine networks, hop-by-hop visibility is especially important because your traffic often crosses multiple provider boundaries. A call from a Globe-connected branch to a PLDT-connected headquarters traverses an interconnection point that neither provider individually monitors on your behalf. Your real-time monitoring layer needs to see across those boundaries.
This layer also feeds your alert system. You define alert thresholds based on your call quality thresholds: if jitter exceeds 30 ms for three consecutive measurement intervals, fire an alert. If MOS drops below 3.5 on calls to a specific trunk, escalate. The alert thresholds should be tighter than your failure thresholds so your team has time to investigate before users notice. A call quality monitoring framework from OMind recommends analyzing R-factor and gap/burst density metrics to identify packet loss patterns, which helps distinguish between steady-state loss (usually a capacity problem) and bursty loss (often a routing or queuing issue).
Feeding Results Back Into Network Configuration
Here’s where the cycle closes, and where most organizations stall. Collecting metrics is straightforward. Acting on them systematically is the hard part.
The feedback mechanism works like this: your monitoring layer generates trend data over days and weeks. You review that data against your baselines and thresholds. When you find sustained degradation or patterns that correlate with specific events, you make a configuration change. Then you re-measure to confirm the change actually helped.
As TestFyra’s benchmarking analysis points out, continuous validation and benchmarking allow organizations to reduce the frequency and duration of outages by optimizing network configurations, improving server performance, and confirming that all components of the VoIP system are functioning at their best. The emphasis on “continuous” is the mechanism’s core: you don’t optimize once and walk away.
Concrete examples of feedback-driven changes for Philippine enterprises include:
- Discovering that jitter spikes every day at 2 PM on your Cebu link, correlating that with a scheduled cloud backup, and rescheduling the backup to run outside business hours
- Finding that MOS on calls through a specific SIP trunk consistently drops below 3.8 during peak hours, and adding a secondary trunk to distribute load
- Identifying that a Fortinet firewall’s SIP ALG is rewriting SIP headers and introducing 20 ms of additional latency per call, then disabling the ALG and applying proper SIP-aware firewall rules instead
- Noticing that remote agents on a particular ISP in Metro Manila show 3% packet loss during afternoon hours, and provisioning a VPN that routes their voice traffic through a different path
Each of these changes gets validated by the same measurement cycle that identified the problem. If jitter doesn’t drop after rescheduling the backup, the cause is somewhere else, and you dig deeper. Understanding when to use packet traces versus system logs for that deeper investigation is a skill worth developing, since the validation cycle tells you something is wrong but doesn’t always tell you why.
Philippine Network Realities That Warp the Cycle
Enterprise VoIP optimization in the Philippines runs into constraints that don’t appear in textbook network engineering guides written for markets with symmetrical fiber to every desk.
ISP reliability varies wildly by region. A validation cycle built for a Manila-centric network will need different tolerance windows for provincial sites where latency baselines are inherently higher and packet loss during typhoon season can spike for days. Your call quality thresholds might be 150 ms latency and 1% packet loss for Metro Manila sites, but 200 ms and 2% for a branch in a secondary city where those numbers represent the best the available infrastructure can deliver.
The World Bank has noted that the Philippines collects less in telecom-sector taxes while the industry simultaneously faces infrastructure challenges that prevent equitable connectivity. For VoIP architects, this translates to practical planning: don’t assume your Davao branch has the same network characteristics as your Makati headquarters, and build your benchmarking framework with per-site baselines rather than a single global standard.
NTC and DICT compliance requirements also affect how you store and transmit monitoring data. If your real-time monitoring system captures call metadata or audio samples for quality analysis, you need to confirm that your data handling aligns with the Data Privacy Act and any sector-specific regulations for healthcare or financial services.
For organizations running business telephone systems across multiple Philippine offices, the validation cycle needs to account for asymmetric link quality between sites. A hub-and-spoke VoIP topology where all calls route through Manila will perform very differently from a mesh topology where branch offices can call each other directly.
Where the Validation Cycle Breaks Down
The mechanism has real limitations, and pretending otherwise leads to over-investment in monitoring infrastructure that doesn’t deliver proportional value.
The first failure mode is alert fatigue. If your thresholds are too tight or your measurement intervals too frequent, your team drowns in notifications. They start ignoring alerts, and the cycle’s feedback loop breaks because nobody acts on the data. Setting thresholds requires judgment about what constitutes actionable degradation versus normal network variation. A 5 ms jitter increase during lunch hour, when half your staff is streaming video, probably isn’t worth an alert.
The second failure mode is measuring the wrong thing. Synthetic test calls travel the same network path as real calls, but they don’t behave identically. A synthetic call using G.711 won’t reveal problems that only manifest under G.729 compression. And if your synthetic test endpoints sit on a dedicated management VLAN that’s separate from your voice VLAN, you’re measuring a different network than the one your phones actually use.
The third and most common failure in Philippine deployments is organizational. The validation cycle requires someone to own it. In mid-sized enterprises without a dedicated voice engineer, the responsibility often falls to a general IT administrator who’s also managing servers, endpoints, and user support tickets. The monitoring tools collect data, but nobody reviews the weekly trend reports, and configuration changes happen reactively when something breaks rather than proactively when metrics start trending in the wrong direction. If your unified communications deployment spans voice, video, and messaging, the data volume from continuous monitoring multiplies, making the ownership question even more pressing.
The fourth limitation is that the cycle measures transport quality, not application quality. A call can have perfect latency, jitter, and packet loss numbers and still sound terrible if the endpoint’s acoustic echo cancellation is malfunctioning, if a Jabra headset’s firmware has a known audio processing bug, or if the codec negotiation between two endpoints settles on a suboptimal codec. Transport-layer benchmarking catches transport-layer problems. Everything above that layer needs different tools.
A well-designed VoIP benchmarking framework acknowledges these boundaries. It tells you when your network is healthy enough to carry voice traffic and alerts you when it isn’t. It won’t tell you why a specific Fanvil phone sounds tinny, or why a user perceives poor quality on calls that your metrics say are fine. The cycle works because it keeps the transport layer honest, and in an environment like the Philippine enterprise market where ISP conditions shift frequently and network loads are unpredictable, that ongoing honesty about your infrastructure’s actual performance is what separates organizations that react to voice complaints from ones that prevent them.