Forty concurrent calls run fine at 8 AM on a BPO floor in Makati. By 10 AM, agents hear choppy audio and one-way silence, even though QoS is configured correctly on every switch and router in the building. The DSCP markings are there. The voice VLAN is isolated. The traffic shaping policy reserves bandwidth for RTP. Something else is breaking the calls, and the network team can’t see it on their dashboard.
This scenario plays out constantly across Philippine enterprises. If you’ve already followed a guide to configure QoS for VoIP on your network and calls still degrade, the bottleneck lives somewhere QoS can’t reach. The question is how to find it.
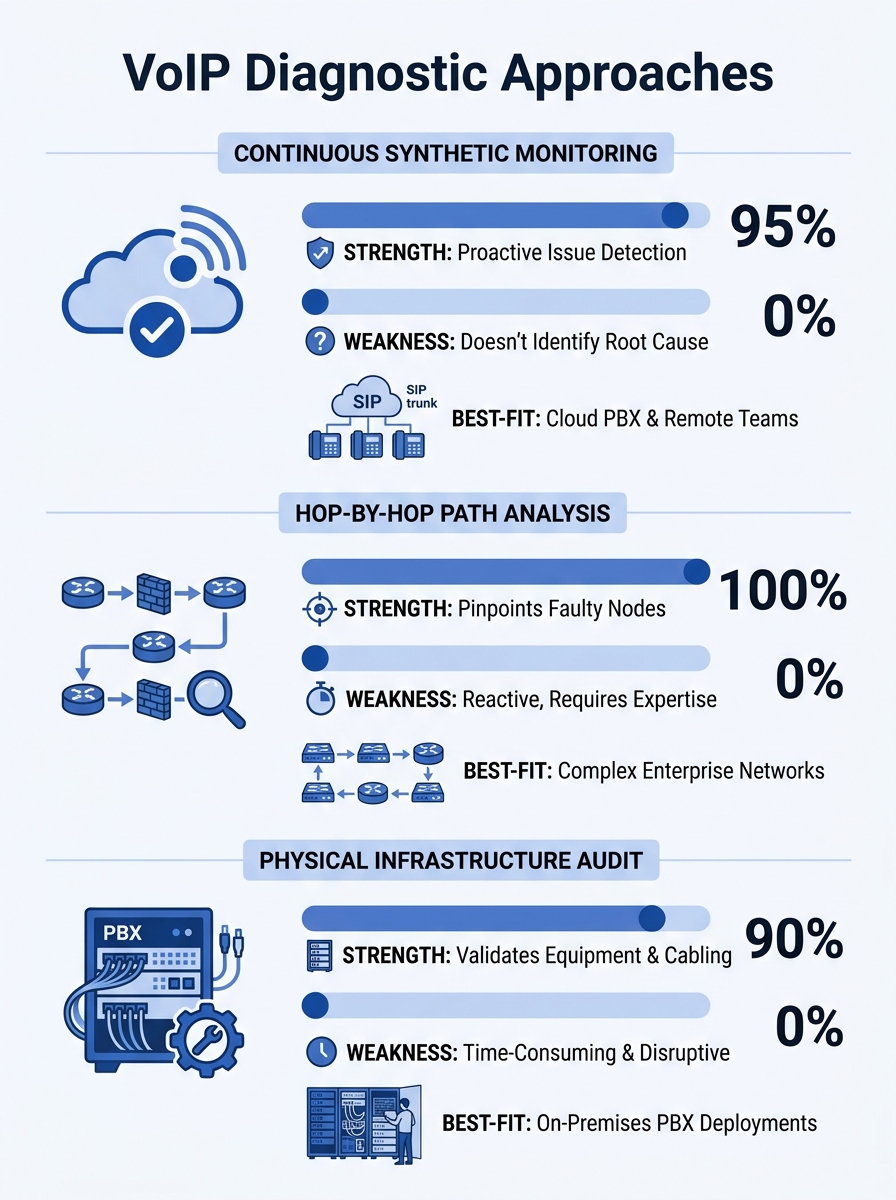
Three diagnostic approaches dominate the field: continuous synthetic monitoring, hop-by-hop path analysis, and physical infrastructure auditing. Each catches a different class of problem, each has real tradeoffs in cost and complexity, and each works better for certain Philippine network conditions than the others. Understanding which one to deploy first can shave weeks off your VoIP call quality troubleshooting process.
Continuous Synthetic Monitoring: The Always-On Baseline
How It Works
Synthetic monitoring tools place lightweight agents at both ends of a network path. These agents exchange test packets at regular intervals, measuring latency, jitter, packet loss, and MOS (Mean Opinion Score) around the clock. The data accumulates into a performance baseline. When conditions degrade, the system flags the deviation before users start complaining.
Tools like Obkio, ThousandEyes, and PRTG operate on this principle. As Obkio’s documentation describes it, proactive testing catches bottlenecks before they impact users, transforming reactive troubleshooting into predictive management.
Where It Excels
For Philippine enterprises dealing with ISP variability, this approach is powerful. PLDT, Globe, and Converge circuits can perform differently at different times of day, and the degradation patterns aren’t always predictable. A synthetic monitor running 24/7 captures the 2 PM slowdown that your team never notices because they test during lunch, or the Sunday maintenance window that clips Monday morning’s first hour of calls.
It’s especially useful for organizations with multiple sites. A hospital network spanning Metro Manila and provincial clinics, or a government agency with regional offices, can place agents at each location and immediately see which links are underperforming. The network performance metrics from continuous monitoring give you hard evidence when you need to file an SLA complaint with your ISP.
The Tradeoffs
Synthetic monitoring tells you that something went wrong and roughly where on the path the degradation occurred. It doesn’t always tell you why. If packet loss spikes at hop 7, you know hop 7 is the problem, but you might not know if that hop is your ISP’s peering point, a misconfigured router, or a saturated link. You still need a second tool to investigate.
Cost is real. Enterprise-tier synthetic monitoring platforms charge per agent or per monitored path. For a 15-site deployment, licensing can run PHP 40,000–120,000 per month depending on the vendor and feature tier. Free tiers exist, but they typically limit historical data retention to 24–48 hours, which defeats the purpose of baseline building.
Setup also requires thought. Agents need to sit inside the voice VLAN to capture voice-path conditions accurately. An agent sitting on the data VLAN measures a different traffic path entirely, and the resulting latency measurement on your Philippine network segments will reflect the wrong queue priority.
Hop-by-Hop Path Analysis: Pinpointing the Guilty Router
How It Works
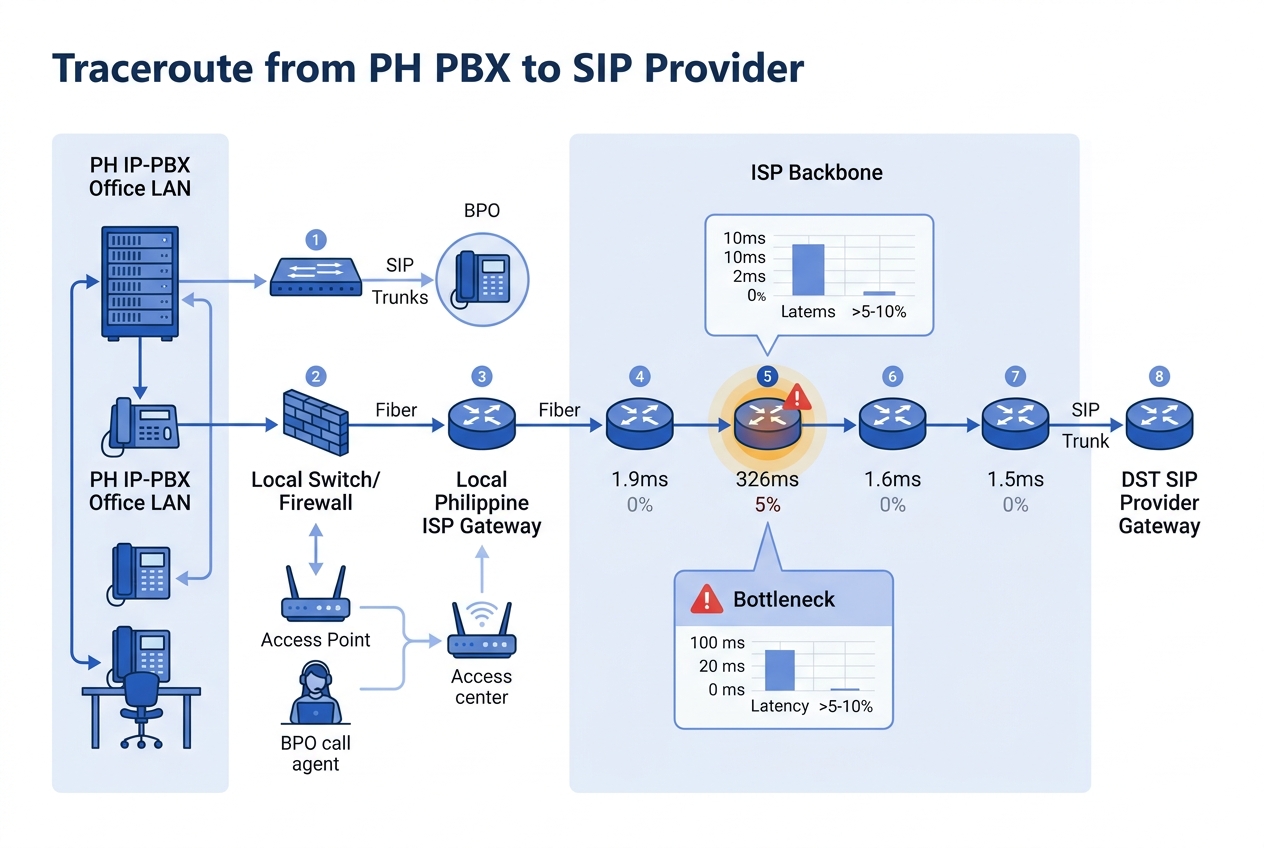
Path analysis tools trace the route packets take between two endpoints and measure performance at each intermediate hop. PingPlotter is the best-known tool in this category. You point it at your SIP provider’s IP address or your remote office’s PBX, and it runs continuous traceroutes while graphing latency and loss at every hop along the way.
The PingPlotter VoIP troubleshooting guide demonstrates a typical finding: a timeline graph shows heavy packet loss originating at a specific hop, while latency remains normal. That pattern means the congestion point is at that particular router or link, not a general bandwidth problem. A WHOIS lookup on the domain of the offending hop reveals whether it’s your equipment, your ISP, or a transit carrier.
Where It Excels
This is the approach that answers the “is it us or is it them?” question. Philippine enterprises frequently argue with their ISP about who owns a VoIP quality problem. Path analysis gives you the evidence. If packet loss identification shows the degradation starts at your ISP’s first router and worsens downstream, you have a concrete case for your account manager. If the loss starts at your own edge switch, you know to look inward.
For organizations already doing network logging as a first line of VoIP defense, path analysis adds the spatial dimension that logs alone can’t provide. Logs tell you a call scored a MOS of 2.1. Path analysis tells you the loss happened at hop 4, which belongs to your ISP’s Metro Manila backbone.
Path analysis is also the most accessible approach for smaller IT teams. PingPlotter costs around USD 30/month for a professional license. A network engineer with basic routing knowledge can interpret the graphs within an hour of first use. For a Cebu-based BPO with a three-person IT team, this is often the right starting point.
The Tradeoffs
Path analysis is reactive by default. You run it when someone reports a problem, or you set it to run on a schedule, but it’s fundamentally a diagnostic tool rather than a monitoring system. If the problem is intermittent and disappears by the time you start tracing, you won’t catch it unless you’ve already been running the trace.
ICMP-based traceroutes (the standard method) have a well-known flaw: many routers deprioritize ICMP traffic. A hop that shows 15% loss on an ICMP trace might actually be handling voice traffic perfectly well, because the router queues ICMP behind everything else. UDP-based tracing is more accurate for VoIP scenarios but requires more configuration.
And path analysis can’t see inside your own LAN in the same way. It traces the WAN path between sites or between your network and the internet, but the 10-meter cable run between your access switch and your IP phone doesn’t show up as a traceroute hop. If the bottleneck is a bad patch cable or a switch port stuck at 100 Mbps half-duplex, path analysis won’t find it.
Physical and Configuration Audit: Finding What Software Can’t See
How It Works
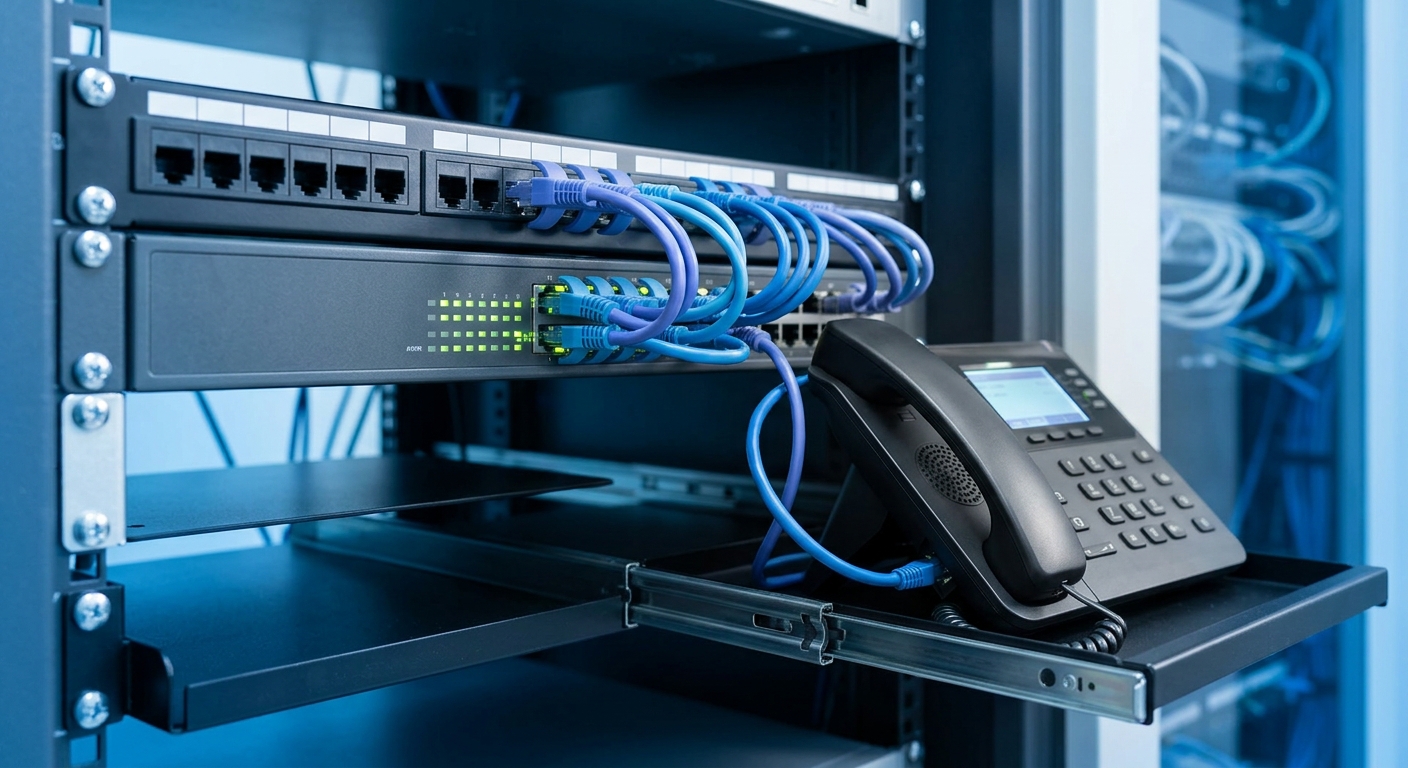
This approach is the least glamorous and often the most effective. A physical and configuration audit involves walking the floor, inspecting hardware, and reviewing every device configuration between the phone and the PBX. You’re looking for problems that exist below the network monitoring layer.
The checklist includes: duplex mismatches on switch ports (a 100 Mbps half-duplex port on a Gigabit network will cause intermittent packet loss under load), damaged or substandard Ethernet cabling, switches that don’t support 802.1p/Q tagging (meaning your DSCP markings get stripped before they reach the first hop), SIP ALG enabled on firewalls (which rewrites SIP headers and breaks call signaling), and firmware bugs on IP phones or switches.
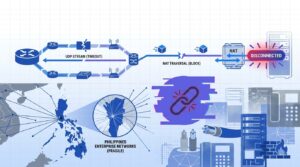
Warning: SIP ALG (Application Layer Gateway) is enabled by default on many Fortinet, TP-Link, and consumer-grade routers. It rewrites SIP packet headers to “help” with NAT traversal, but in practice it corrupts call signaling and causes one-way audio, dropped calls, and registration failures. Disable it on every firewall in your voice path.
Where It Excels
Philippine networks accumulate technical debt in ways that are specific to the local market. Many enterprises grew their networks organically, adding unmanaged switches during office expansions, running Cat5 cable in ceiling spaces where temperature and humidity degrade it over time, or inheriting equipment from a previous tenant’s fit-out. These physical problems produce symptoms that look identical to WAN congestion on a monitoring dashboard, but no amount of ISP troubleshooting will fix them.
Cisco’s VoIP QoS documentation makes this point clearly: fragmenting VoIP packets can cause numerous call setup and quality problems, and fragmentation often happens because of MTU mismatches between devices that nobody audited. A Fanvil X-series phone sending 214-byte RTP packets through a switch with a 1500-byte MTU works fine, but add a VPN overlay that reduces the effective MTU to 1400 bytes, and suddenly packets fragment, jitter spikes, and calls crackle.
This audit approach is particularly valuable for hospital communication systems where VoIP equipment coexists with medical devices, biomedical telemetry, and wireless patient monitoring on the same network infrastructure. Interference and configuration conflicts in clinical environments are common and invisible to synthetic monitors.
A single backup job or video stream can spike traffic and ruin call quality even when QoS is configured, because the underlying infrastructure can’t enforce the policy.
The Tradeoffs
Auditing takes time and physical access. A 200-seat office with 12 switches, 3 routers, and 200 IP phones takes a full day to audit properly. If you have multiple offices across Davao, Cebu, and Metro Manila, the logistics of site visits add up. You need someone with hands-on experience with your specific equipment, whether that’s Yeastar PBXs, Cisco Catalyst switches, or Dell PowerSwitch infrastructure.
The audit also produces a point-in-time snapshot. You might fix every issue you find and then have a cleaning crew kick a patch cable loose three weeks later. Without ongoing monitoring (see Option 1), you won’t know until someone calls the help desk.
And configuration audits require change windows. Fixing a duplex mismatch means briefly dropping the port. Disabling SIP ALG means restarting the firewall’s inspection engine. In a BPO running 24/7, or at a bank with zero tolerance for voice downtime, scheduling these changes requires coordination that slows the remediation process.
How to Choose Between These Three
No single approach catches every class of bottleneck. The right choice depends on your team’s size, your budget, and the symptoms you’re seeing.
Pick continuous synthetic monitoring first if your VoIP problems are intermittent and time-dependent. If call quality is fine for three days and then terrible for two hours on a Thursday afternoon, you need an always-on system to capture the pattern. This is the right starting tool for multi-site enterprises, especially those whose VoIP infrastructure spans public networks between offices.
Pick hop-by-hop path analysis first if you suspect the problem is your ISP or a WAN link. If call quality degrades specifically on calls that traverse the internet (to a SIP trunk provider, to a remote office over a VPN), path analysis will isolate the offending hop faster than any other method. It’s also the best option when your IT team is small and your budget is limited, because the tooling is cheap and the learning curve is gentle.
Pick a physical and configuration audit first if your problems are consistent and site-specific. If one floor of your building always has bad calls while another floor is fine, or if problems started after an office renovation, the answer is almost certainly physical. Bad cables, misconfigured switch ports, and SIP ALG don’t show up in network monitoring dashboards, and they won’t respond to QoS tuning.
The mature network bottleneck diagnosis strategy uses all three in combination. Synthetic monitoring provides the ongoing baseline, path analysis investigates specific incidents, and periodic audits (quarterly is a reasonable cadence) catch the physical-layer drift that accumulates over time. If your call quality suffers and you’ve already verified your QoS configuration, working through these three approaches in sequence will find the problem. Sometimes it’s a saturated ISP link. Sometimes it’s a misconfigured firewall. And sometimes it’s a Cat5e cable that a chair wheel has been slowly crushing for six months. You can see more about distinguishing between packet-level and log-level diagnostics in our deep-dive on that topic.
The Philippine network environment, with its mix of fiber, LTE failover, and occasionally aging copper last-miles, means that the problem could be at any layer. QoS handles the part of the network you control. These three approaches help you find everything else.