Wireshark’s VoIP Calls panel, found under the Telephony menu, reconstructs entire SIP signaling flows from raw PCAP files and maps each call’s RTP streams to measurable jitter, packet loss, and codec data. For Philippine enterprises routing voice over congested WAN links, this single panel replaces hours of manual packet-by-packet inspection with a visual ladder diagram that pinpoints the exact message where a call broke down.
The Escalation Loop That Logs Should Have Broken
When call quality collapses at a Philippine enterprise, the reflex is to blame the ISP. The IT team opens a ticket with PLDT or Globe, waits 48 to 72 hours for a response, gets told the circuit looks clean, opens another ticket, and repeats. Three weeks pass. Users keep complaining about one-way audio on calls between the Makati headquarters and a Cebu branch. Nobody has looked at what the PBX actually logged.
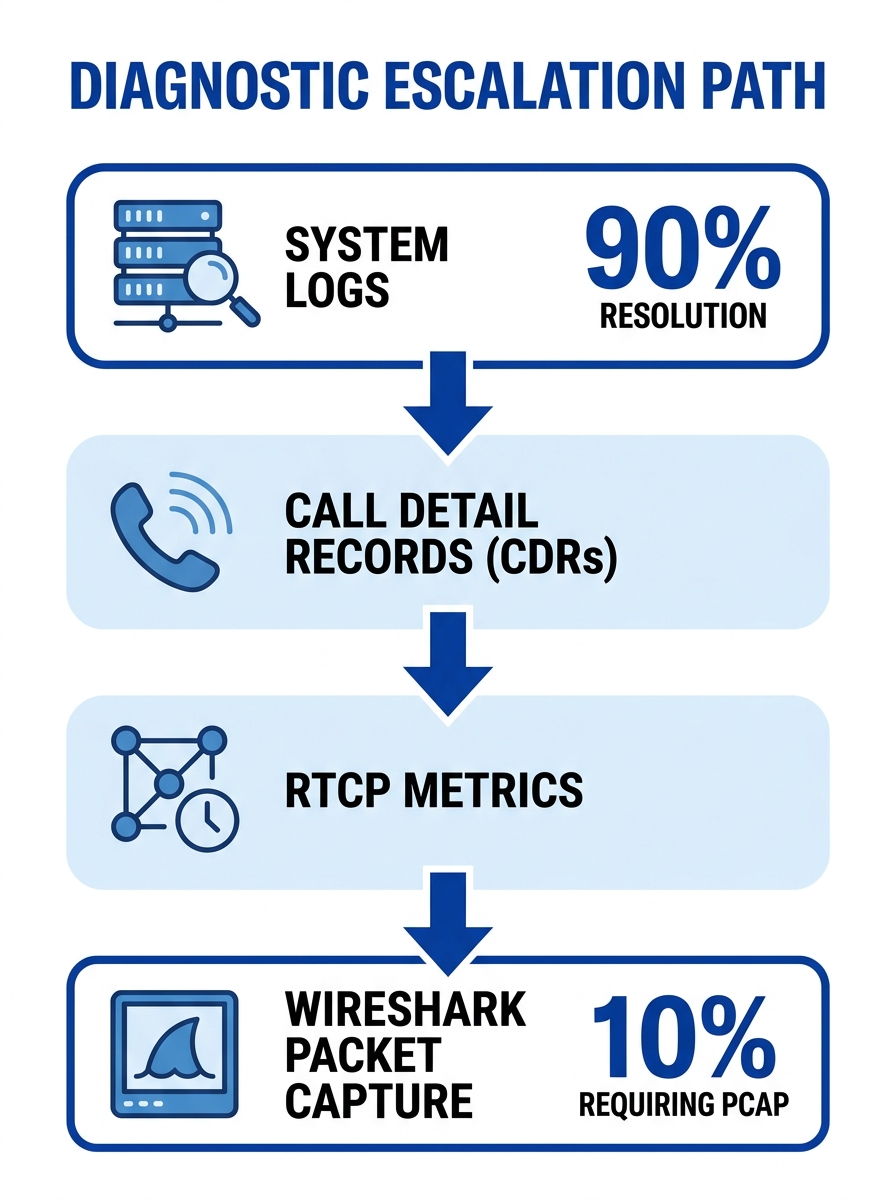
This pattern repeats because Philippine enterprise IT teams treat packet capture as the first diagnostic step when it should be closer to the last. System logs, call detail records, and RTCP metrics resolve root causes in roughly 9 out of 10 cases, according to diagnostic workflow analysis. A SIP log will show you a 408 Request Timeout (network reachability failure) or a 488 Not Acceptable Here (codec mismatch) within seconds of pulling it up. No mirror port, no PCAP file, no 30 to 45 minutes of Wireshark setup.
The scenario worth dissecting is the remaining 10%: the cases where logs show a normal 200 OK response, calls appear to connect, but users report garbled audio, one-way voice, or random mid-call drops. These are RTP-layer problems, and they’re invisible in SIP logs. The only way to see them is to capture the actual UDP voice packets traversing the network and measure what happened to each one.
That’s where Wireshark VoIP troubleshooting shifts from optional skill to diagnostic necessity. And it’s where Philippine enterprises, particularly BPOs running 200+ concurrent outbound calls, consistently get the workflow wrong. The detailed root-cause analysis toolkit covers the broader diagnostic hierarchy, but the packet capture phase itself deserves its own walkthrough.
Capture Point Selection on the Voice VLAN
The diagnostic value of a PCAP file depends entirely on where you captured it. Mirroring traffic at the wrong switch port gives you a file full of packets that never touched the problematic path, and you’ll spend an hour analyzing clean data while the real failure happens two hops away.
For a typical Philippine enterprise VoIP deployment with a Yeastar or Asterisk-based PBX, the optimal capture point sits between the PBX’s LAN interface and the session border controller (SBC) or SIP trunk gateway facing the carrier. This position captures both the SIP signaling and the RTP media streams for every call traversing the WAN. Port mirroring on a managed switch (Cisco Catalyst, Dell PowerSwitch, or similar) sends a copy of all traffic on the voice VLAN to a dedicated monitoring port where your Wireshark laptop connects.
Once the capture is running, display filters control what you actually see. The filter expression sip || rtp shows both signaling and media packets simultaneously, which is what you want for call quality diagnostics. For isolating specific failure types, Wireshark’s SIP method filters narrow the view: sip.Method == “INVITE” shows only call setup requests, sip.Method == “REGISTER” shows device registration attempts, and sip.Method == “BYE” shows call termination sequences.
Before any RTP analysis will work, you need to enable RTP protocol decoding. As Yeastar’s support documentation explains, you go to the Analyse tab, then Enabled Protocols, then search for RTP and make sure it’s checked. Without this step, Wireshark treats RTP packets as generic UDP traffic, and the VoIP Calls panel returns empty results. This single missed checkbox accounts for a surprising number of “Wireshark can’t find any calls” support queries.
Warning: Backplane bandwidth matters. Port mirroring on a 48-port voice VLAN during peak hours at a BPO can push 400 to 600 Mbps of mirrored traffic. If your monitoring port is a 1 Gbps link, you’ll start dropping the very packets you’re trying to analyze. Use a 10 Gbps uplink or capture during off-peak windows for high-density deployments.
Reading the SIP Ladder Diagram for a Failed Cebu Branch Call
With a clean capture running and the right filters applied, Wireshark’s Telephony > VoIP Calls panel becomes the primary diagnostic surface. Opening it presents a list of every detected call in the capture, showing source IP, destination IP, call state, and duration. Selecting a call and clicking Flow Sequence generates the SIP ladder diagram that maps the entire signaling exchange between endpoints.
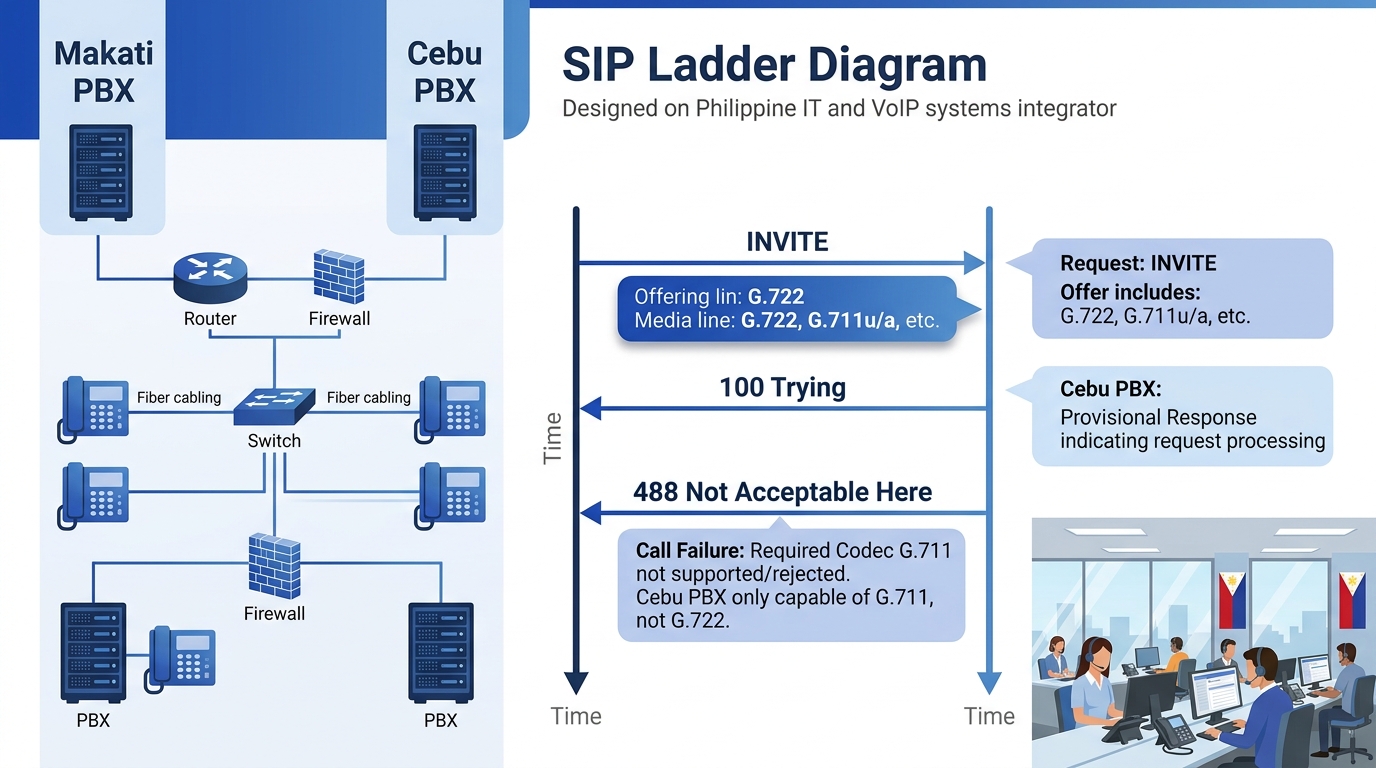
The ladder diagram for a successful call follows a predictable pattern: INVITE from the caller, 100 Trying from the proxy, 180 Ringing from the destination, 200 OK when the callee answers, ACK to confirm, then BYE when either party hangs up. Each message appears as an arrow between two vertical lines representing the endpoints.
In this walkthrough’s scenario, the call between Makati headquarters and the Cebu branch shows something different. The INVITE reaches the far-end PBX. A 100 Trying comes back. Then instead of 180 Ringing, the diagram shows a 488 Not Acceptable Here response. The call never rings. The user hears silence for 3 seconds, then a fast busy tone.
The 488 response means the two endpoints couldn’t agree on a media codec. Drilling into the SIP INVITE’s Session Description Protocol (SDP) body reveals the problem: the Makati PBX offered only G.722 (a wideband codec consuming 64 kbps), while the Cebu branch PBX was configured to accept only G.711 a-law. Network assessment research shows that multi-codec testing with G.711, G.722, and Opus is standard practice precisely because codec mismatches are among the most common SIP packet capture findings in Philippine enterprise deployments.
A 488 Not Acceptable Here in the ladder diagram means the two endpoints couldn’t agree on a single codec. The call was dead before it ever rang.
This particular failure pattern is invisible in the PBX’s call detail records. CDRs for a 488 response often log the call as “failed” with no further detail, and the SIP cause code gets buried in a log file nobody checks. The ladder diagram makes it immediately visible. For teams already familiar with decoding SIP call failures at the signaling layer, the 488 is a one-glance diagnosis.
RTP Jitter Analysis Across the PLDT Aggregation Path
Codec mismatches produce clean failures. The harder diagnostic problem is degraded audio on calls that technically connect. Users describe garbled voice, robotic-sounding speech, or words dropping out mid-sentence. These symptoms point to RTP stream degradation, and the culprit is almost always jitter or packet loss on the WAN path.
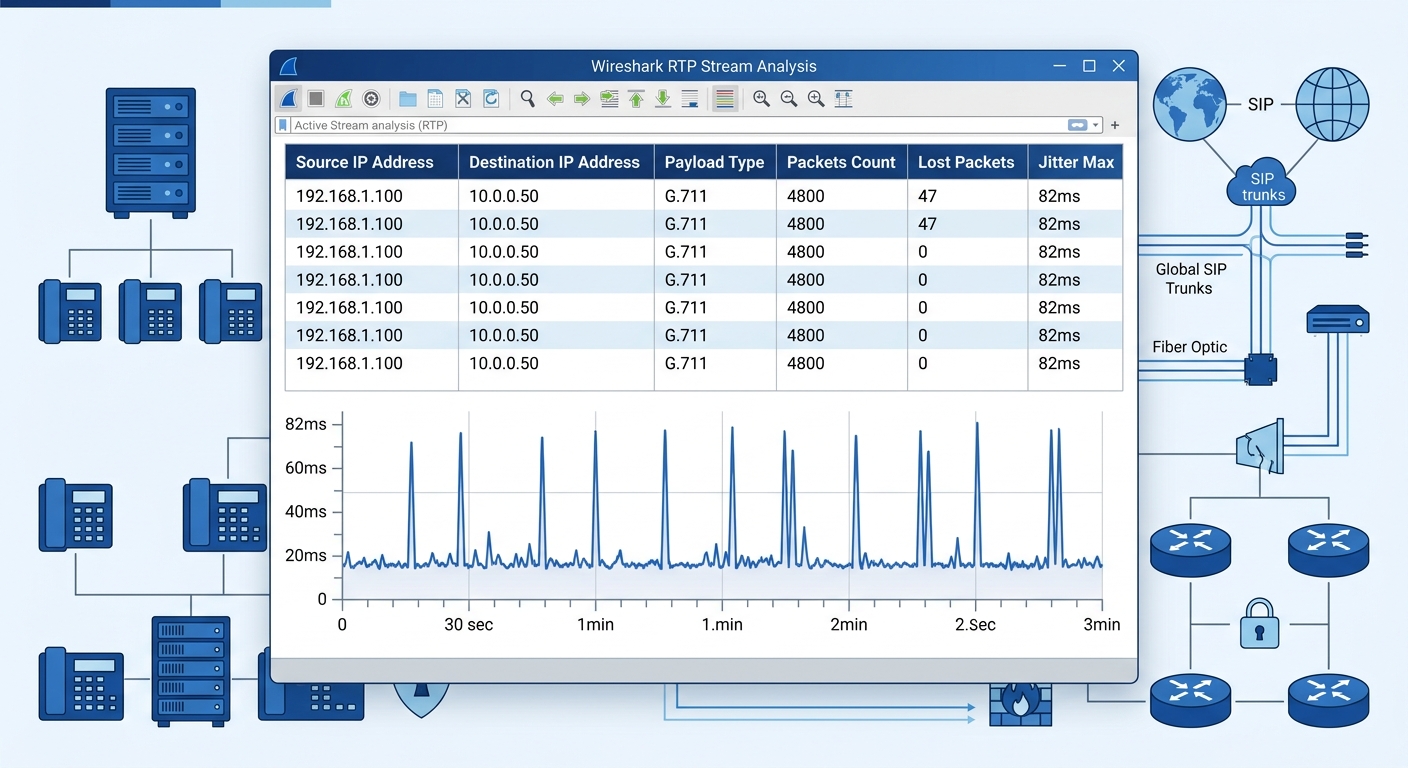
Wireshark’s Telephony > RTP > RTP Streams panel lists every detected RTP stream in the capture with columns for source address, destination address, payload type (codec), packet count, lost packet count, and maximum jitter. For a G.711 call at 8 kHz sampling, the acceptable jitter threshold is 30 milliseconds. Packet loss above 1% produces audible degradation. Above 3%, the call becomes unusable.
In Philippine enterprise networks, latency problems often trace to WAN circuits between Metro Manila headquarters and provincial branch offices, especially on MPLS links that traverse multiple carrier aggregation points. A call between Makati and Davao might cross 4 to 6 aggregation hops on a PLDT or Globe MPLS circuit. Each hop adds 3 to 8 milliseconds of latency under normal load. During peak business hours (9 AM to 12 PM and 2 PM to 5 PM Philippine time), congestion at any single aggregation point can spike jitter from a stable 12 milliseconds to 80 or 90 milliseconds. That’s enough to overwhelm the jitter buffer on most IP phones, which typically accommodates 20 to 60 milliseconds depending on the handset manufacturer.
Selecting an RTP stream in Wireshark and clicking Analyze gives you a per-packet jitter graph. The pattern matters as much as the numbers. Steady jitter at 15 milliseconds is fine. Periodic spikes to 70+ milliseconds every 30 to 45 seconds suggest a competing traffic flow (often a backup job or a large file transfer) contending with voice packets on the same QoS queue. Continuous high jitter above 40 milliseconds across the entire call usually indicates an undersized or congested WAN link.
The comparison between SD-WAN and MPLS for multi-site VoIP is directly relevant here. SD-WAN deployments with per-packet steering can route around a congested MPLS path in real time. Pure MPLS relies on the carrier to manage congestion at their aggregation points, and your only leverage is the SLA. The RTP jitter data from your Wireshark capture becomes the evidence you attach to that SLA dispute ticket, replacing vague complaints about “bad call quality” with timestamped, per-packet proof.
Right-clicking on a SIP INVITE packet and selecting Follow > SIP Call shows the full SIP dialog alongside its associated RTP streams. This cross-reference is critical: it ties the signaling (which codec was negotiated, which IP addresses were in the SDP) to the media quality (what actually happened to the voice packets). Without this cross-reference, you’re diagnosing symptoms without connecting them to the call that produced them.
PCAP Files Under Republic Act 10173
Every packet capture containing RTP voice data is, in a meaningful legal sense, a call recording. The audio payloads inside those UDP packets are decodable. Wireshark can play them back directly from the RTP Streams panel (Telephony > RTP > RTP Streams > select stream > Play Streams). A PCAP file emailed to an ISP support engineer or saved to an unencrypted USB drive carries the same privacy exposure as distributing an MP3 of the conversation.
Republic Act 10173, the Data Privacy Act of 2012, classifies voice communications as personal information when they can be linked to an identifiable individual. For regulated verticals like healthcare, banking, and BPO (where calls may contain protected health information or financial account data), a PCAP file leaked or mishandled can trigger NPC enforcement action. The penalty structure under RA 10173 includes fines from PHP 500,000 to PHP 5 million and imprisonment of 1 to 6 years for unauthorized processing of personal information.
Practical safeguards for enterprise SIP packet capture work should follow the same protocols applied to call recordings. Store PCAP files on encrypted volumes. Delete them within 7 to 14 days of closing the diagnostic ticket. Never email raw PCAPs to external parties; use a secure file-sharing platform with access logging. If your enterprise network security architecture includes a SIEM, log every port-mirroring session as a security event with the operator’s identity, timestamp, and capture duration.
And restrict who can run captures in the first place. The IT team member doing Wireshark VoIP troubleshooting on a 300-seat BPO floor has passive access to every active call’s audio content. That access should be documented in the company’s data privacy impact assessment and limited to named individuals with a legitimate diagnostic purpose. The VoIP security hardening checklist covers the broader access control framework, but PCAP handling deserves a specific entry in every Philippine enterprise’s data protection policy.
Tip: Wireshark supports capture filters (applied before writing packets to disk) in addition to display filters (applied after capture). Using a capture filter like **udp port 5060** limits the PCAP to SIP signaling only, excluding RTP audio payloads entirely. This approach gives you the ladder diagram and codec negotiation data without ever touching the voice content, dramatically reducing your privacy exposure.
The Codec Fix and the WAN Upgrade Memo
The resolution for the Cebu branch scenario required two changes. The codec mismatch was fixed in 10 minutes by adding G.722 to the branch PBX’s allowed codec list, giving both endpoints a common wideband option. The jitter problem took longer. The RTP analysis data, exported as a CSV from Wireshark’s RTP Streams panel, went into a memo to the carrier documenting 47 lost packets across a 3-minute sample call (1.6% loss) and jitter peaks of 82 milliseconds against an SLA ceiling of 30 milliseconds. The carrier upgraded the QoS policy on the aggregation link within 5 business days.
The total diagnostic time from opening Wireshark to identifying both root causes was about 40 minutes. The prior three weeks of ISP escalation tickets had produced zero actionable information because nobody had provided the carrier with packet-level evidence. The CDRs said “call failed.” The SIP logs said “488.” But the CDRs didn’t say why the codec lists diverged, and the SIP logs didn’t contain any RTP data at all. The call quality diagnostics workflow required both layers, examined together.
For teams building a repeatable call flow diagnostics and packet capture toolkit, the sequence matters: logs first, then RTCP reports, then PCAP only when the first two layers leave unanswered questions. When you do reach for Wireshark, capture at the right point, filter to what you need, and treat the resulting file with the same care you’d give a call recording. In Philippine regulatory context, that last step is the one that separates a well-run diagnostic program from a compliance liability.