Ookla’s H2 2024 connectivity report measured Smart’s median mobile latency at 46 ms, a number that consumes nearly a third of the 150 ms one-way budget before voice packets reach the far end. A real-time call quality dashboard tracking MOS scores, jitter, latency, and packet loss converts scattered complaints into patterns you can act on.
The Average MOS Score Hides the Worst Calls
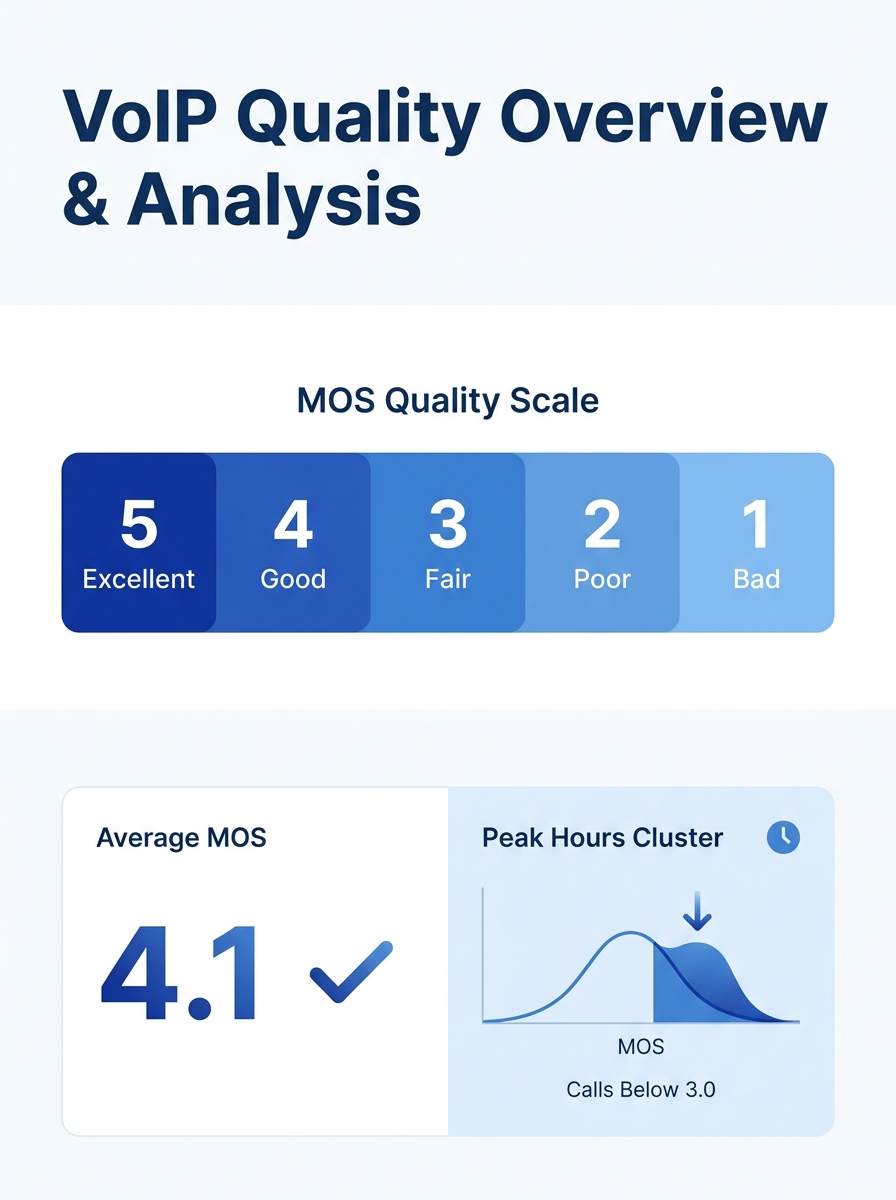
Mean Opinion Score runs on a scale of 1 to 5, where 4.0 to 4.5 represents toll-quality voice and anything below 3.5 enters the range callers describe as choppy, robotic, or unusable. Most VoIP systems report a single average MOS across all calls over a given period, and that average reliably masks problems. A BPO floor running 2,000 calls per day in Cebu might show a comfortable 4.1 average while 8% of those calls dip below 3.0 during the 2:00 to 4:00 PM congestion window. The agents fielding those calls hear the difference, but the dashboard showing only the average does not.
Sipfront’s April 2026 analysis of MOS calculation methods confirms that monitoring tools derive MOS from real-time RTP metrics including round-trip time, jitter, and total lost packets per second. These models approximate perceived quality well under stable conditions, but they break down when conditions shift quickly. That’s exactly what happens on Philippine ISP links during business hours. The fix is tracking percentile distributions instead of averages. Your dashboard should surface the 5th-percentile MOS (the worst 5% of calls) alongside the median. When the 5th-percentile drops below 3.0 even while the average holds at 4.0, you’ve identified a problem affecting dozens or hundreds of calls daily.
This is where building an automated monitoring and alert framework pays off. Threshold-based alerts can trigger when MOS falls below 3.5 on any individual call, or when the rolling 5th-percentile crosses 3.0 over a 15-minute window. VoIPmonitor’s platform supports KPI threshold alerting and trend anomaly detection across millions of CDR records, with live call views that give NOC teams visibility into degradation as it happens rather than the next morning in a summary report.
Jitter Damages Calls Twice as Fast as Latency
Philippine IT teams tend to fixate on latency because it’s the metric you can test with a single ping command. But NetBeez’s research on VoIP impairment found that jitter is twice as degrading as latency, a relationship reflected in the effective latency calculation where the jitter value gets multiplied by two before being added to one-way delay. A link showing 80 ms latency and 40 ms jitter produces an effective latency of 160 ms, which pushes beyond the 150 ms threshold where conversation quality degrades noticeably.
Packet loss compounds the damage further. At just 0.5% loss on a G.711 codec stream running at 64 kbps, callers hear gaps and clipping. At 1% loss, audio becomes difficult to follow during the fast-paced conversations BPO agents handle every minute of every shift. The interaction between these three metrics is multiplicative rather than additive: 50 ms latency alone is fine, 20 ms jitter alone is manageable, and 0.3% packet loss alone is barely noticeable. Combine all three on the same call and MOS drops from 4.2 to 3.4, crossing the threshold from acceptable to problematic.
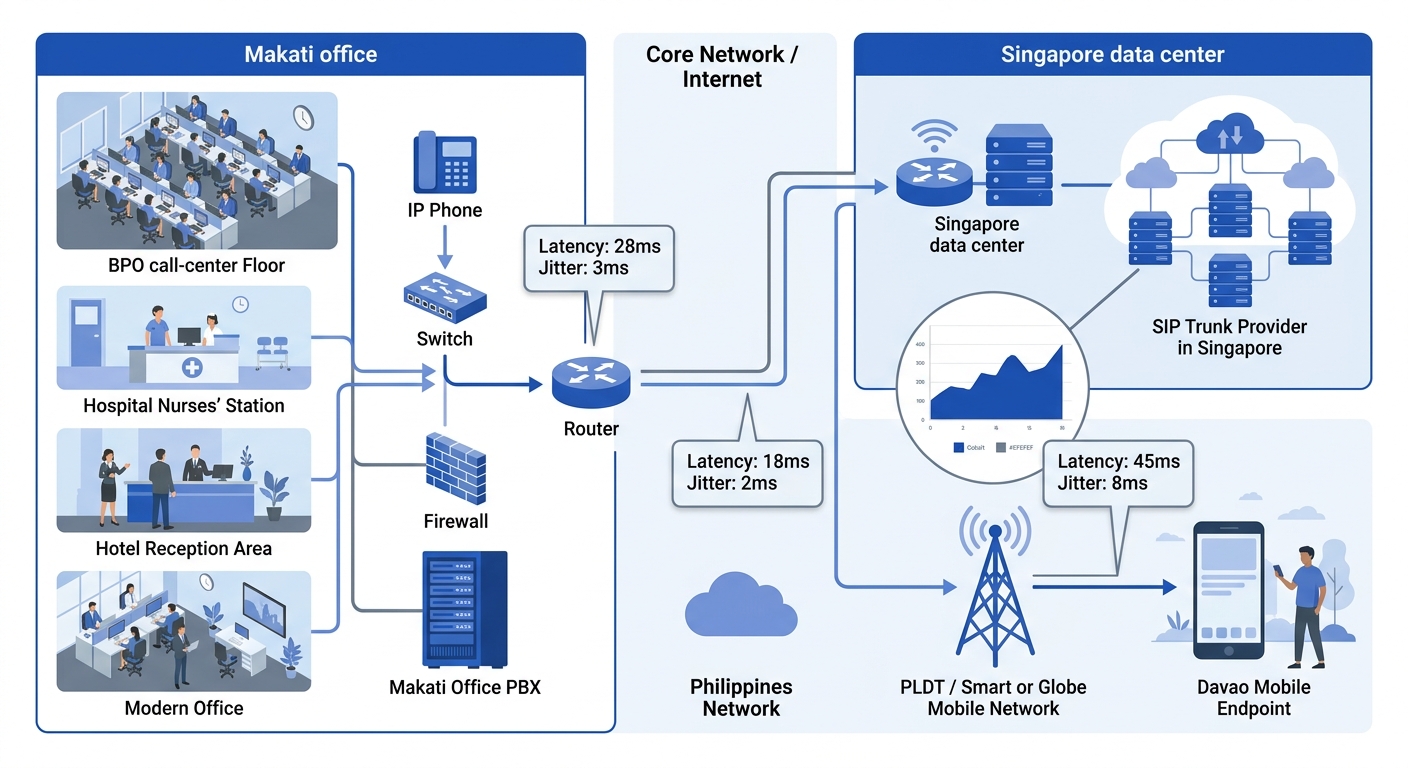
Philippine networks make this worse because traffic frequently crosses multiple ISP boundaries. A call originating from a PLDT fiber connection in Makati, routed through a SIP trunk provider’s data center in Singapore, and terminating on a Globe mobile connection in Davao traverses at least three autonomous systems. Each boundary adds jitter variance. Ookla’s H2 2024 data shows Smart achieving median upload speeds of 7.41 Mbps with 46 ms latency, but median figures don’t capture the 95th-percentile spikes during peak hours when latency can double or triple. Jitter latency measurement across each segment of the path, rather than just end-to-end, reveals which ISP boundary or which local switch is responsible for degradation. Tools like Iperf can generate controlled UDP streams that test throughput, delay, jitter, and packet loss on individual segments, giving you granular data that a simple speed test never will.
When you’ve identified jitter as the primary culprit, QoS configuration on your edge routers becomes the immediate lever. Prioritizing DSCP-marked voice packets over bulk data traffic reduces jitter at the points you control, even when the ISP segments remain unpredictable.
From Raw Numbers to an Operational Dashboard
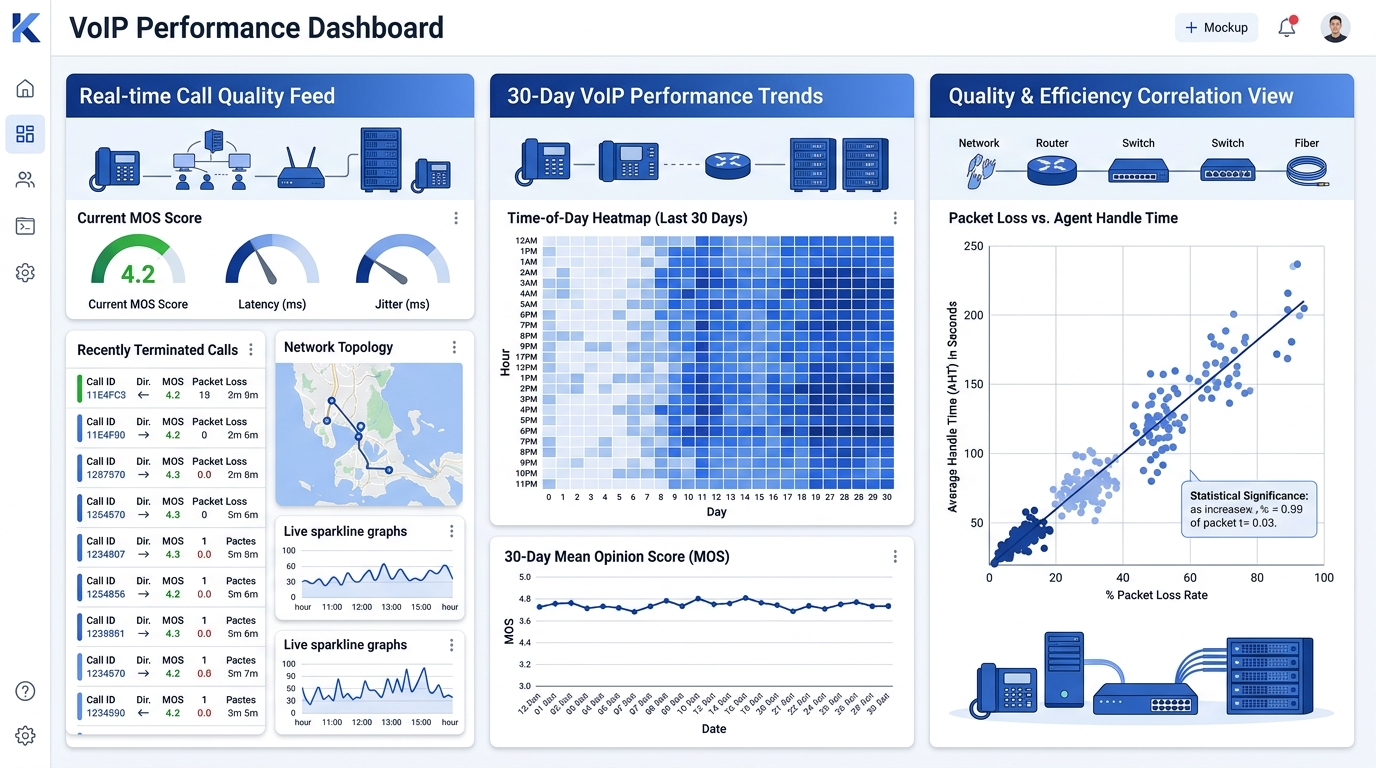
The distinction between collecting VoIP performance metrics and running a useful call quality dashboard is structure. SolarWinds’ VoIP Network Quality Manager analyzes call detail records and call management records to determine per-call MOS alongside jitter, latency, and packet loss. But the tool is only as good as the views you build on top of it. Philippine network diagnostics require three specific views working together: a real-time call quality feed, a historical trend panel, and a correlation layer that maps metric degradation to specific network events.
The real-time feed should show every active call’s MOS, jitter, and packet loss, updated every 10 seconds. This is the view your NOC watches during business hours. VoIPmonitor’s live call view with 3D quality graphs serves this purpose, providing instant visibility into degradation on individual calls. For a 200-seat BPO operation with 150 simultaneous sessions, this feed surfaces the 5 or 10 calls currently experiencing problems, letting a technician intervene by checking the SIP signaling layer or rebalancing trunk routes before the agent even submits a ticket.
The historical trend panel matters because many quality problems in the Philippines follow predictable cycles. Congestion peaks between 2:00 PM and 5:00 PM on weekdays. Undersea cable maintenance windows create latency spikes that last hours. A 30-day MOS trend panel broken down by hour-of-day exposes these patterns and lets you schedule synthetic test calls, ideally every 5 to 15 minutes during business hours, to establish baseline performance across all network paths. When the test call MOS at 3:00 PM on Tuesday drops to 3.2 while the 9:00 AM baseline holds at 4.3, you have quantifiable evidence to present to your ISP or to justify a secondary SIP trunk.
A dashboard showing only average MOS across all calls will reliably tell you everything is fine during the exact hours your agents are struggling with choppy audio.
The correlation layer is the hardest to build but the most valuable. When 12 agents report choppy audio at 3:15 PM, the dashboard should let you overlay that cluster against WAN interface utilization, codec selection on those specific calls, and any concurrent backup or file-transfer jobs consuming bandwidth. BPO operations track average handle time and queue wait times through their own dashboards; connecting those metrics to the call quality dashboard reveals whether rising AHT correlates with degraded MOS, which would indicate that poor audio is forcing agents to ask callers to repeat themselves. That correlation turns a network metric into a cost figure that finance teams understand immediately.
The Uncomfortable Limit of Measurement
All of this assumes the numbers tell the whole story, and they don’t. A call with a MOS of 3.8, technically acceptable, can still frustrate a caller if the degradation clusters in the first 3 seconds before the jitter buffer stabilizes, because first impressions anchor perception for the rest of the conversation. A call with a MOS of 4.4 can generate a complaint if the agent’s Jabra headset introduces a ground-loop hum that no RTP metric will ever detect. The gap between what the dashboard measures and what the human ear perceives is real, and no amount of packet-level analysis with Wireshark closes it entirely.
This is why structured user feedback has to run alongside the dashboard. Converting agent complaints into diagnostic data means capturing five specific fields per report: time of occurrence, call type (inbound, outbound, or internal), symptom description (choppy audio, echo, one-way audio, silence), device and headset model, and frequency (first time, recurring, or constant). When you can match a cluster of echo complaints from agents using a specific Fanvil X-series handset to calls showing normal jitter and latency, you’ve isolated a device-level acoustic issue that the dashboard would never flag. When you match choppy audio complaints to calls with 35 ms jitter and 0.7% packet loss during a specific 90-minute window, you’ve confirmed a network problem and narrowed the timeframe for your ISP support ticket.
The dashboard gives you the language to have those conversations with ISPs, with management, with vendors. It provides evidence instead of anecdotes. But evidence of what the network is doing differs from evidence of what callers are experiencing. The teams that get the most value from MOS score monitoring are the ones that treat the dashboard as half the picture and build the feedback loop to fill in the rest. The metrics tell you where to look. The people on the calls tell you what you’re actually looking for.