Cisco Unified Communications Manager reports two different quality indicators depending on the phone model connected to it: Mean Opinion Score for legacy endpoints and Concealment Ratios for newer ones. These numbers look like they measure the same thing. They don’t, and confusing them is where call quality diagnostics usually derails before it starts. The mechanism behind VoIP performance analysis is a layered stack of interdependent metrics, each pointing to a different part of your infrastructure. Understanding how these layers interact is how you move from “the calls sound bad” to “port 3 on the access switch in the third-floor IDF has a CRC error rate of 0.4%.”
How CUCM Reports Quality and Why the Numbers Diverge
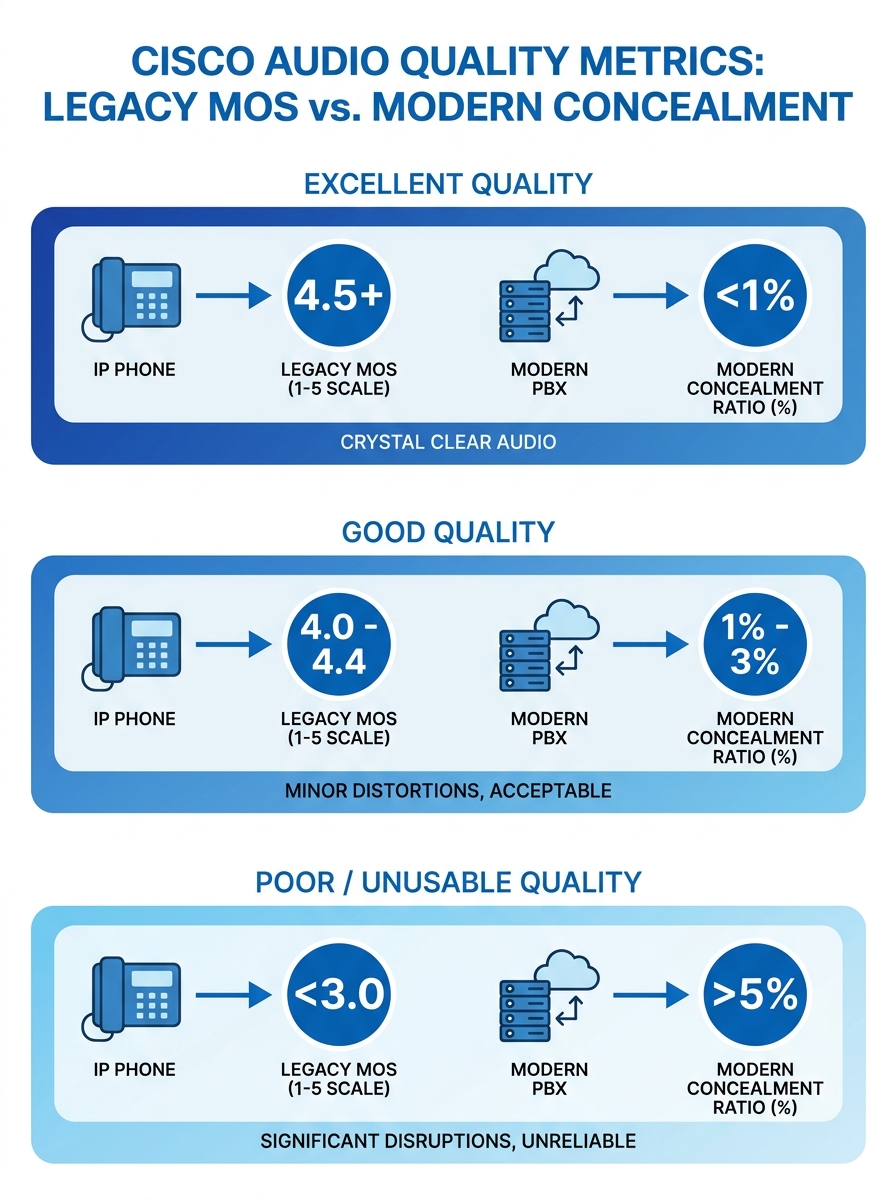
Legacy Cisco IP phones (the 7900 series that still populate many Philippine BPO floors and government offices) calculate a MOS value locally and report it back to CUCM via Call Management Records. That MOS is derived from the G.711 or G.729 codec’s expected quality ceiling, then degraded algorithmically based on observed packet loss and jitter during the call. A perfect G.711 call tops out at MOS 4.41. A perfect G.729 call caps at 3.92. Your MOS will never exceed these ceilings regardless of how clean your network is.
Newer Cisco phones (the 8800 and 9800 series) don’t report MOS at all. Instead, they report Concealment Ratios: the percentage of voice frames where the phone had to interpolate or mask missing audio because RTP packets arrived late or never arrived. A Severely Concealed Seconds Ratio above 3% typically correlates with noticeable audio degradation. As VoIP Detective documents, CUCM troubleshooting in mixed environments requires a tool that can normalize both metrics into a single view. Without that normalization, you’re comparing percentages to a 1-5 scale and drawing wrong conclusions.
If you’re running a Yeastar P-Series or S-Series alongside CUCM endpoints (common in Philippine mid-market setups where departments buy their own gear), you’ll get CDR-based quality data in a third format entirely. The diagnostic challenge multiplies with every platform in the mix.
The Four Metrics Under Every Voice Stream
Every RTP voice stream, regardless of vendor or platform, is subject to four measurable network conditions. These are the raw inputs that determine whether a call sounds clear or sounds like the other person is talking through a tunnel.
Latency is the one-way delay from speaker to listener. The ITU-T G.114 recommendation sets 150 milliseconds as the upper bound for acceptable one-way delay. Beyond that threshold, conversation becomes awkward because speakers start talking over each other. In Philippine enterprise networks, latency problems often trace to WAN circuits between Metro Manila headquarters and provincial branch offices, especially on MPLS links that traverse multiple PLDT or Globe aggregation points.
Jitter measures the variation in packet arrival times. Your phone’s jitter buffer absorbs some of this variation by holding packets briefly and playing them in order. Jitter below 30 milliseconds is generally absorbable. Above that, the buffer either grows (adding latency) or discards late packets (creating gaps). Cisco Meraki’s MI VoIP Health dashboard measures loss, latency, jitter, and MOS based on probe responses to the provider’s SIP servers, giving you a continuous read on these values without waiting for user complaints.
Packet loss is the percentage of RTP packets that never arrive. Even 1% loss produces audible artifacts. At 3%, most listeners will describe the call as “choppy.” At 5%, the call is functionally unusable for business conversation. The tricky part: packet loss can be asymmetric. Your side sounds fine to you while the remote party hears gaps, because the loss is happening on the return path.
MOS is a composite score derived from the other three metrics plus the codec’s quality ceiling. It’s useful as a summary indicator but dangerous as a diagnostic tool on its own, because a MOS of 3.5 doesn’t tell you whether the cause is high latency, high jitter, or packet loss. You need the component metrics to act.
A MOS of 3.5 doesn’t tell you whether the cause is high latency, high jitter, or packet loss. You need the component metrics to act.
From Metric to Root Cause: Tracing the Signal Path
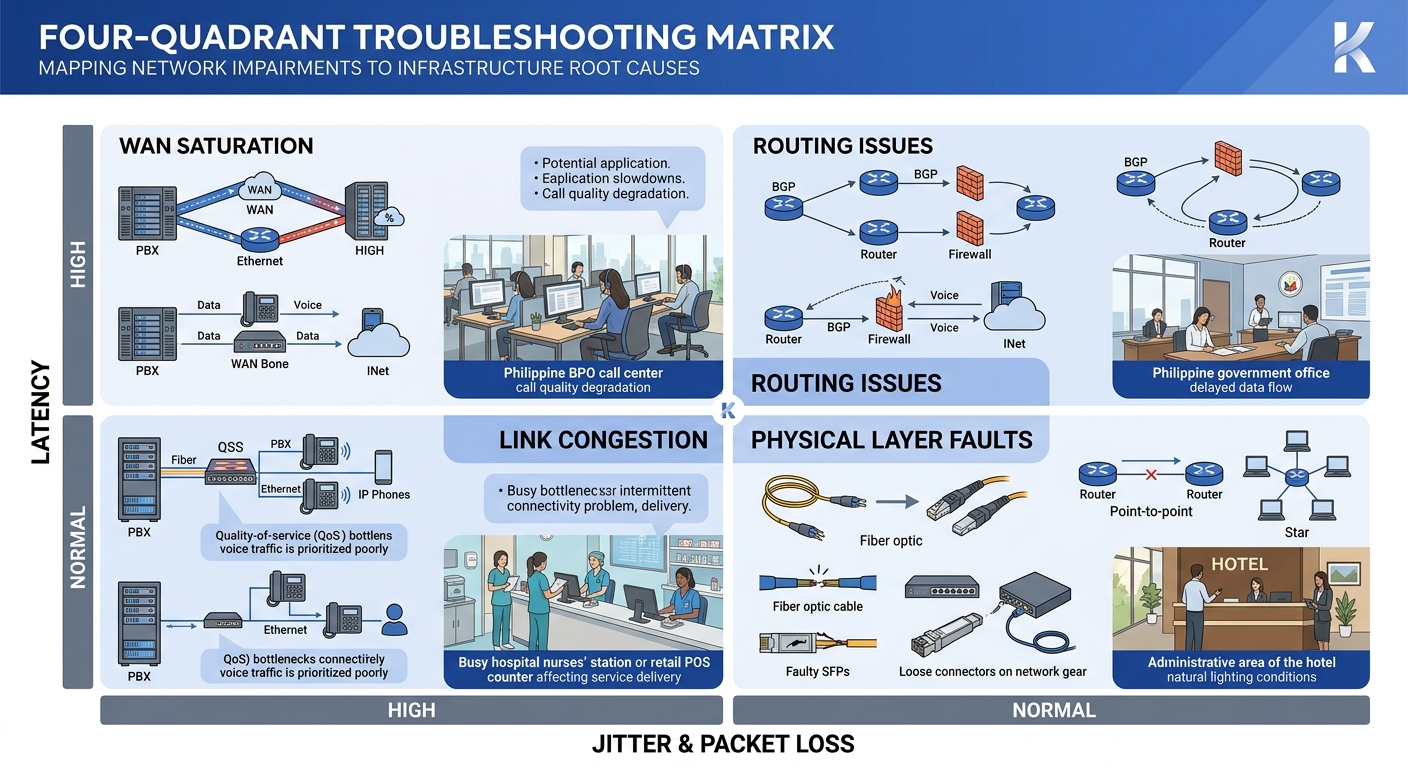
The diagnostic mechanism works by mapping each metric anomaly to a specific infrastructure layer. This is where call quality diagnostics becomes genuinely useful instead of just confirming that “something is wrong.”
High latency with normal jitter and zero packet loss points to routing path issues. The packets are all arriving, and they’re arriving consistently, but they’re taking too long. Check your traceroute between endpoints. In Philippine networks, this pattern often shows up when traffic between two offices on the same carrier takes an unexpected hop through an international peering point. It also appears when hidden network bottlenecks exist at the QoS boundary between your LAN and your WAN provider’s edge router.
High jitter with moderate packet loss usually indicates congestion on a shared link. Voice packets are competing with bulk data transfers, backup jobs, or video streams. If you’ve configured DSCP 46 for voice but your ISP strips DSCP markings at their edge (common with Philippine business-grade internet circuits), your QoS policy stops working the moment traffic leaves your building.
Packet loss with low latency and low jitter is the most infrastructure-specific pattern. It often means a physical layer problem: a bad cable run, a failing switch port, or a PoE injector that’s browning out under load. This is where your network cabling infrastructure matters concretely. Cat5e patch cables that were fine for 100 Mbps data traffic can introduce bit errors at gigabit speeds when runs exceed 50 meters or pass through areas with electromagnetic interference from fluorescent lighting or elevator motors.
Simultaneous degradation across all four metrics on all endpoints in a site suggests an upstream WAN or ISP problem, a saturated uplink, or a switch backplane issue. If degradation is limited to a single VLAN, the cause is more likely a misconfigured trunk port or spanning tree reconvergence event.
Passive Monitoring vs. Synthetic Testing
Infrastructure metrics monitoring for VoIP splits into two fundamentally different approaches, and Philippine enterprises typically need both.
Passive monitoring captures data from actual calls as they happen. CUCM’s built-in CDR and CMR records are passive monitoring. So are tools like VoIPmonitor, an open-source platform that inspects SIP call flows and RTP quality in real time by mirroring traffic from a SPAN port or network TAP. The advantage of passive monitoring is that it measures real user experience. The disadvantage is that you only get data when calls are happening. If your CEO calls you at 7 AM to report bad call quality from the night before, passive monitoring gives you historical data to review, but only if you were capturing it.
Synthetic monitoring generates test calls or probe packets on a schedule, regardless of whether real calls are flowing. SolarWinds VNQM runs IP SLA operations (UDP jitter tests, ICMP echo tests) between Cisco routers to measure voice-path quality continuously. Meraki Insight sends probes to SIP servers. These synthetic tests catch degradation during off-hours or on links that carry intermittent voice traffic, like the circuit connecting your Cebu branch to the Davao warehouse that only handles a few calls per day.
The mechanism works best when both approaches feed into the same dashboard. Synthetic tests give you a continuous baseline. Passive monitoring tells you whether real calls match that baseline. A gap between the two (synthetic tests look clean but real calls sound bad) points to endpoint-specific problems: a phone’s network adapter, a headset issue, or a Jabra speakerphone with firmware that handles jitter buffer adaptation poorly.
Tip: If you’re running enterprise network health checks on a Cisco environment, configure IP SLA responders on routers at each remote site. This gives SolarWinds VNQM or similar tools a measurement endpoint without requiring additional hardware. For Yeastar deployments, the built-in network diagnostic tools (ping, traceroute, and packet capture) can fill a similar role on a smaller scale.
We covered the broader discipline of building a continuous benchmarking framework for Philippine enterprise networks in a separate piece. The short version: without a known-good baseline, every metric is ambiguous.
The Network Stack Below Your Voice Platform
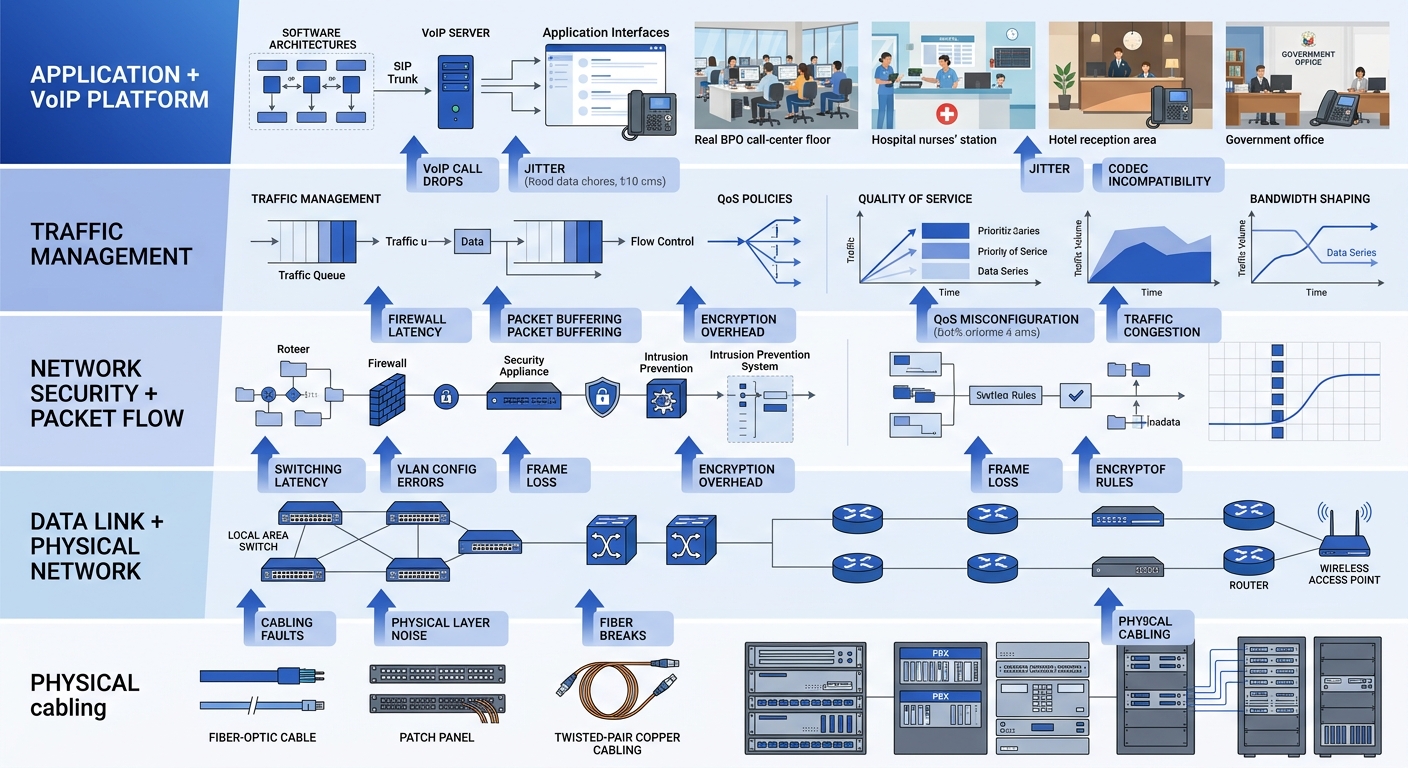
Call quality diagnostics often fixate on the VoIP layer (SIP signaling, RTP streams, codec selection) while ignoring the network infrastructure that carries it all. The mechanism breaks down at this boundary if you aren’t watching the right counters.
Switch-level metrics matter enormously. Interface error counters (CRC errors, runts, giants, input errors) on the access switch ports where your IP phones connect are early warning indicators. A phone plugged into a port showing 200 CRC errors per hour will produce intermittent packet loss that looks random until you check the physical layer. Most managed switches from Cisco, Fortinet, or Dell expose these counters via SNMP, which means your monitoring platform can poll them automatically.
Spanning tree topology changes deserve attention too. Every topology change event on a VLAN causes a brief forwarding interruption. On a voice VLAN, that interruption translates to 1-3 seconds of silence or audio distortion. If your network logs show frequent topology change notifications, you likely have a device flapping or a misconfigured redundant link. Reviewing network logs as a first line of defense helps catch these events before they become chronic call quality complaints.
Your enterprise network security layer can introduce latency too. Firewalls doing deep packet inspection on RTP streams add processing delay. If your Fortinet FortiGate or Cisco Firepower is inspecting voice traffic at the application layer, you may be adding 5-20 milliseconds of latency per firewall hop. Voice VLANs should bypass application-layer inspection and rely on network-layer ACLs instead.
Where This Framework Breaks Down
This diagnostic model assumes you have visibility into the infrastructure carrying your voice traffic. That assumption fails in several common Philippine enterprise scenarios.
When voice traffic traverses the public internet between sites (because an MPLS circuit was too expensive or the provincial office only has a single ISP connection), you lose visibility into the middle of the path. You can measure conditions at both endpoints, but you can’t see the congested peering point three hops into your ISP’s backbone. Synthetic testing helps, but you’re inferring the problem location rather than observing it directly. If your architecture relies on multi-office VoIP over public networks, accept that some diagnostic blind spots are permanent without carrier cooperation.
Work-from-home agents present another gap. A BPO operation with 200 agents working from residential PLDT Fibr or Converge connections has 200 last-mile networks it doesn’t control and can’t monitor. The best you can do is deploy a lightweight agent on the endpoint (NetBeez, Obi’s softphone diagnostics, or the built-in quality metrics in Obi’s Obi-based clients) and correlate that data with your platform’s CDR records.
And the framework can’t diagnose problems that originate in the analog world. Echo caused by impedance mismatches on FXO trunks connecting to PSTN lines, acoustic echo from speakerphones in tiled conference rooms, or background noise from a BPO floor with 150 agents in an open-plan layout will all degrade perceived call quality without moving any of the four digital metrics. MOS stays at 4.2, jitter is 8 milliseconds, packet loss is zero, and the client still can’t understand the agent. Those problems live outside the infrastructure metrics stack entirely, in the domain of acoustic engineering and endpoint hardware selection.
The framework is strongest when the problem is digital, the path is visible, and the endpoints report honest data. Knowing where those conditions don’t hold is as important as knowing the diagnostic steps themselves.