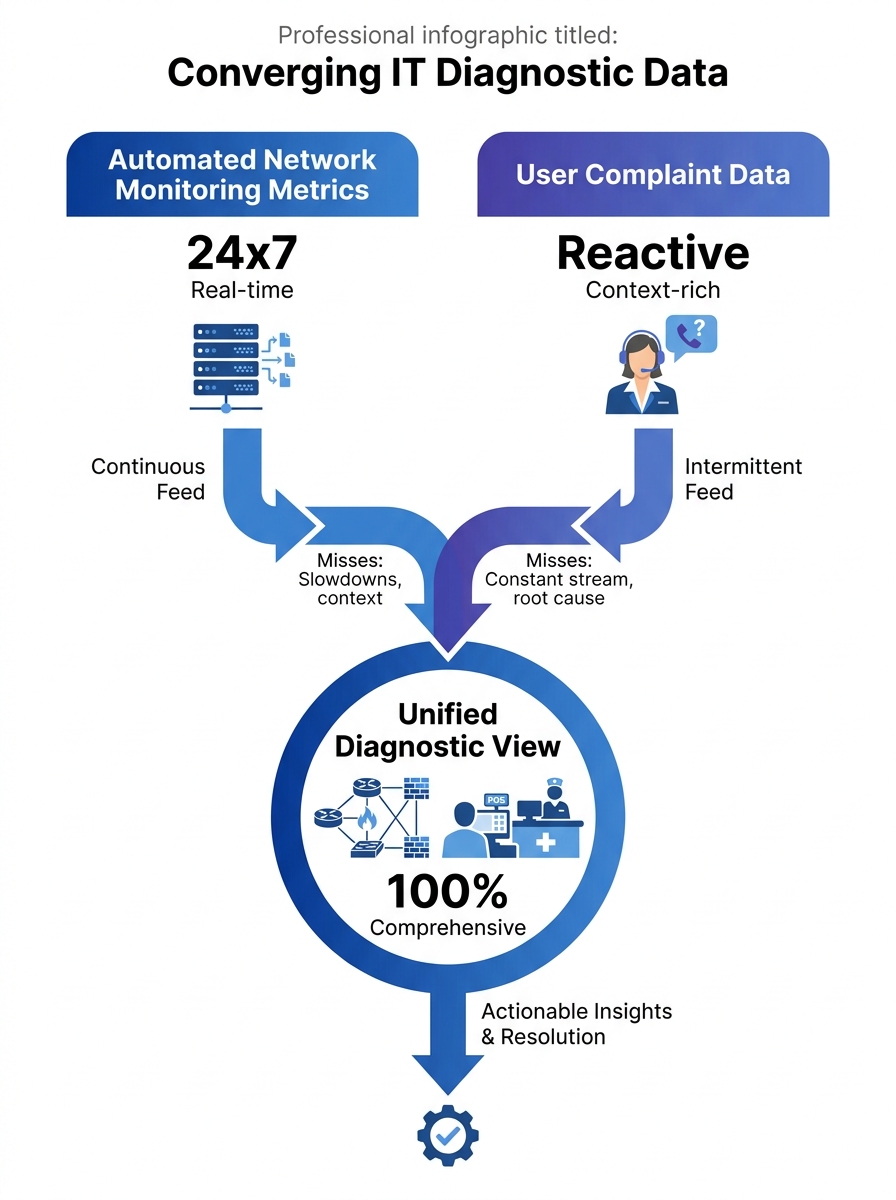
Mean Opinion Score readings above 4.0 on your monitoring dashboard can coexist with a flood of user complaints about garbled audio and dropped calls. When that happens, the users are almost always right, and your instrumentation is measuring the wrong thing at the wrong time.
This disconnect matters because MOS is typically sampled at the SIP gateway or media server, aggregated across all calls in a reporting interval, and smoothed into a number that looks healthy. User perception, by contrast, happens at the endpoint: after the signal traverses the last segment of your internal LAN, passes through a PoE switch, and arrives at a Fanvil or Yeastar desk phone or a Jabra headset plugged into a softclient. The metric and the experience can genuinely diverge, and when they do, the help desk ticket is a better diagnostic signal than the dashboard. Philippine enterprise communications teams that learn to read those tickets as structured data gain a network diagnostics capability that no monitoring tool provides on its own.
Why Automated Metrics Miss What Users Catch
Network monitoring platforms like SolarWinds VoIP Network Quality Manager can correlate call quality with infrastructure metrics such as CPU utilization, interface status, latency, and response time on IP SLA source devices. That’s powerful. But it operates on a polling interval, and it measures the path between points that your monitoring infrastructure knows about. It doesn’t measure the path between your user’s desk and the ceiling-mounted access point that just had its firmware updated, or the micro-burst congestion on a shared VLAN during the 2 PM shift change at a BPO site in Quezon City.
Users notice problems that happen between polling cycles. They notice quality degradation on specific call types (international routes to Australia, internal extensions to the Cebu satellite office, three-way conferences with external participants). They notice that calls are fine at 8 AM and awful at 3 PM. They notice that transferring a call drops the audio for two seconds. These are granular, time-stamped, context-rich observations that your SNMP traps and CDR records simply don’t capture with the same fidelity.
The problem is that most VoIP troubleshooting workflows treat user complaints as a trigger to go look at the real data, the machine-generated logs and packet captures. The complaint itself gets reduced to a ticket category: “call quality” or “dropped call.” Everything specific the user said gets discarded in translation.
Turning Complaints Into Structured Diagnostic Records
The fix starts with how you collect the complaint. A free-text field in your ticketing system that says “Describe the issue” produces unusable noise. A structured form that asks five specific questions produces queryable data.
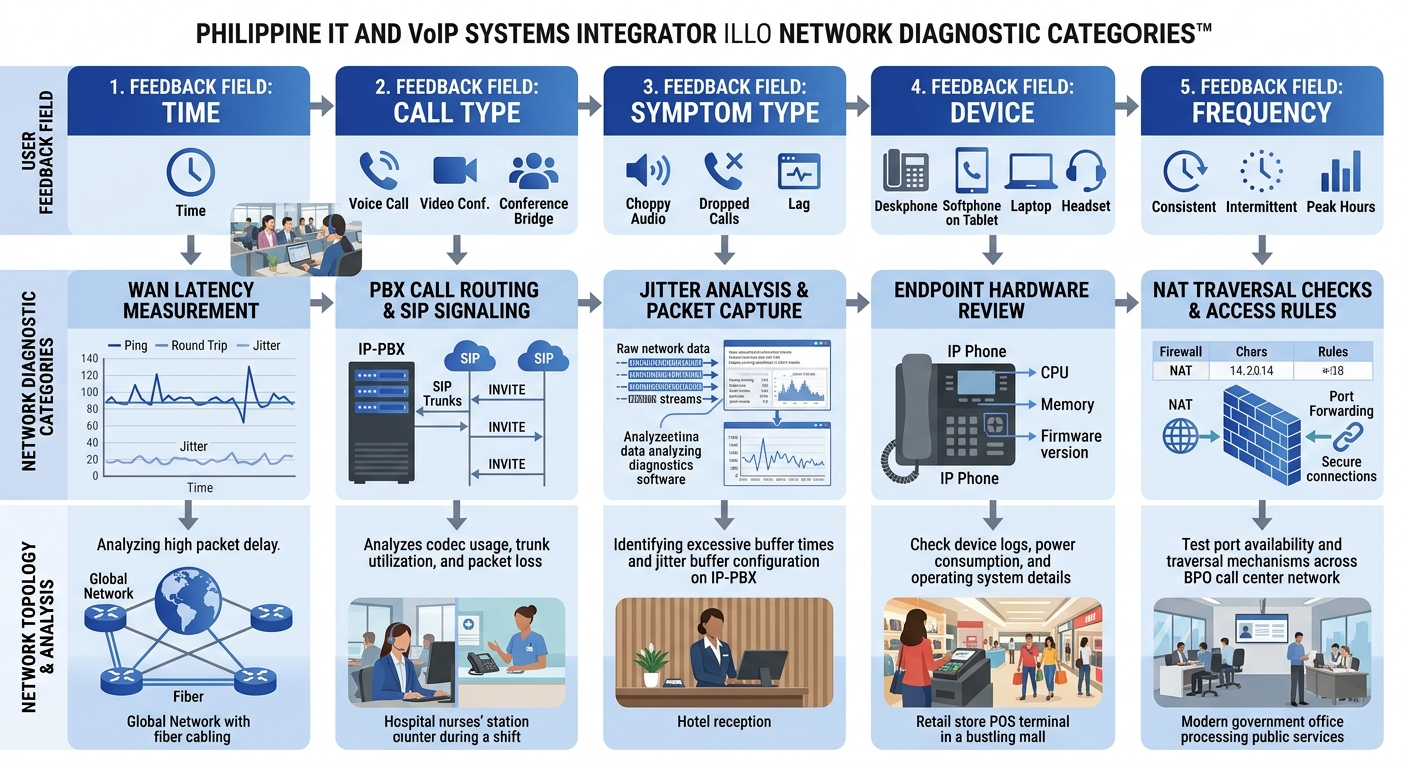
Those five questions, adapted for Philippine enterprise environments:
- When did the problem occur? Not “today” or “this morning.” The form should include a time picker with 15-minute granularity. If the user can pinpoint the time to within a quarter hour, you can cross-reference against your Fortinet or Cisco switch logs for that exact window.
- What kind of call was it? Internal extension-to-extension, outbound to mobile, outbound to landline, inbound from external, conference call. Each call type follows a different network path and passes through different SIP trunks. If you’ve gone through the work of diagnosing where call quality actually degrades in your infrastructure, this field lets you narrow the scope immediately.
- What did the problem sound like? This is the question most IT teams skip, and it’s the most valuable. Offer a checklist: choppy/robotic audio, echo, one-way audio, static or buzzing, delay between speaking and hearing, complete silence, call dropped entirely. Each symptom maps to a different network condition. Choppy audio points to jitter or packet loss. Echo suggests an impedance mismatch or acoustic feedback at the endpoint. One-way audio almost always indicates a NAT or firewall problem with RTP media streams. Delay suggests buffering or high latency on the WAN link.
- What device were you using? IP desk phone (model), softclient on a laptop (wired or Wi-Fi), mobile app. This narrows the endpoint and, critically, tells you whether the user was on a wired or wireless connection.
- Has this happened before? If yes, how often? Daily, weekly, only during certain hours? Pattern data from users is how you detect intermittent issues that don’t show up in a single packet capture.
Tip: Build this form as a required template in your help desk platform. In ServiceNow, Freshservice, or even a shared Google Form, the goal is to make every complaint produce the same five data points. Within 30 days you’ll have enough records to run frequency analysis by time-of-day, call type, and symptom category.
When you structure feedback this way, each ticket becomes a row in a diagnostic database. Twenty tickets saying “choppy audio” on outbound calls to mobile numbers between 1 PM and 4 PM, all from users on the third floor of your Makati office, tells you more about your network than a week of passive monitoring.
Correlating User Reports With Network Telemetry
Structured complaints become genuinely powerful when you overlay them on your existing monitoring data. This is where user reporting protocols connect with network diagnostics infrastructure.
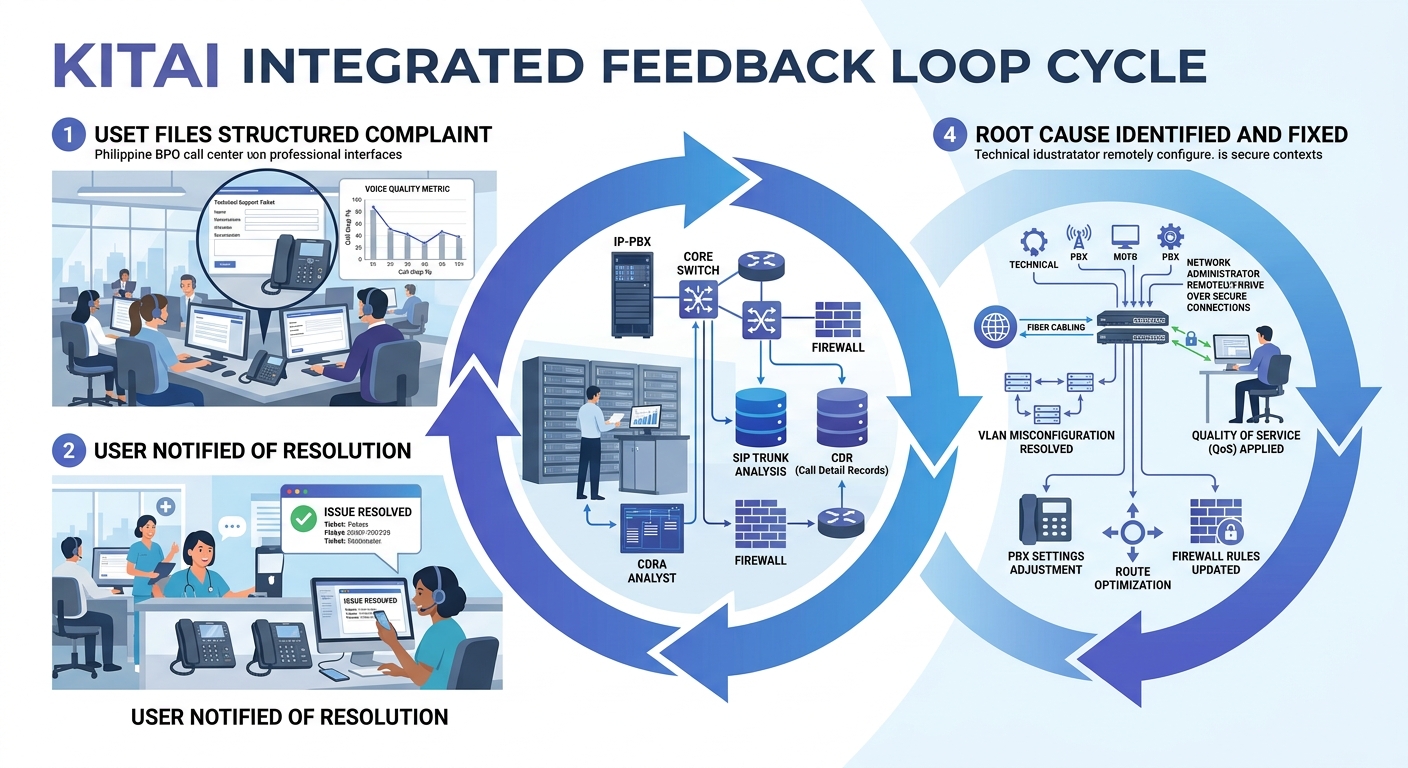
The workflow looks like this: a cluster of complaints arrives pointing to a specific time window and symptom type. Your network team pulls switch logs, QoS queue statistics, and SIP ladder diagrams for that window. Advanced troubleshooting platforms can auto-generate SIP ladder diagrams showing complete message flow between endpoints, servers, and network components, making it immediately clear where call setup or media delivery fails.
Without the user complaint to narrow the time window and symptom type, your team would be scrolling through hours of logs looking for anomalies. With it, they’re looking at a 15-minute window for a specific kind of failure on a specific call path. The difference in time-to-resolution is enormous.
For organizations that have already established continuous benchmarking practices for VoIP, complaint correlation adds a layer that synthetic testing can’t replicate. Your synthetic test calls traverse a known path at a scheduled time. Your users’ real calls traverse every path at every time. When five users on Wi-Fi in the same building wing all report one-way audio during the same hour, and your AP controller logs show a channel utilization spike on that wing’s access points, you’ve found a problem that no synthetic probe would have detected.
Twenty tickets saying “choppy audio” on outbound calls between 1 PM and 4 PM, all from the third floor of your Makati office, tells you more about your network than a week of passive monitoring.
AI-Assisted Pattern Detection
Tools from vendors like Plivo now offer AI-driven analysis of call patterns and debug logs to identify recurring issues proactively. When combined with structured user feedback, these systems can surface correlations that humans miss: for instance, that complaints about echo spike every time a specific SIP trunk provider routes calls through a particular media gateway, or that packet loss complaints cluster around the same 20-minute window when your backup system runs its daily snapshot on a shared network segment.
For Philippine BPO operations running hundreds of concurrent calls, this kind of automated correlation between agent feedback and network telemetry is the difference between chasing individual complaints for weeks and identifying a root cause in hours. If your environment has hidden bottlenecks that persist even with QoS configured, user feedback patterns are often the first evidence that something upstream of your QoS policy is the real culprit.
Building a Feedback Culture That Actually Produces Data
Technical systems only work if people use them. In many Philippine offices, the default user behavior when VoIP quality degrades is to switch to a mobile phone, send a Viber message instead, or simply tolerate the problem. The complaint never gets filed. The diagnostic signal never enters your system.
Changing this requires three things:
Make reporting fast. If it takes more than 90 seconds to file a complaint, adoption will be near zero. A one-click “Report Call Issue” button in your softclient UI or a QR code on the desk phone that opens a pre-filled mobile form removes the friction. Yeastar PBX systems, for example, allow custom speed-dial codes that can trigger automated call quality feedback prompts after a call ends.
Close the feedback loop visibly. When a user’s complaint leads to a fix, tell them. Send a brief message: “Your report about choppy audio on March 12th helped us identify a switch misconfiguration on Floor 3. The issue has been resolved.” This does more for reporting adoption than any policy memo.
Aggregate and publish. A monthly one-page report to department heads showing complaint trends, identified causes, and fixes completed builds organizational confidence that reporting produces results. It also gives you political cover for infrastructure investment requests, because you’re backing them with documented user impact data rather than abstract capacity metrics.
Philippine-Specific Realities That Shape This Approach
Call quality feedback systems in Philippine enterprises run into a few specific challenges worth naming directly.
ISP variability across regions. A multi-site organization with offices in Metro Manila, Cebu, and Davao will have different ISP providers, different last-mile technologies, and different congestion patterns at each site. User complaints are the fastest way to detect when a regional ISP is degrading during peak hours, because your centralized monitoring may only see the aggregate WAN link, not the per-user experience behind it. PLDT, Globe, and Converge each have different congestion profiles depending on the area and time of day, and no monitoring tool captures that as quickly as a user who says “my calls to external numbers have been terrible every afternoon this week.”
Shared infrastructure in commercial buildings. Many Philippine offices, especially in provincial cities, operate on shared building internet connections with limited QoS enforcement at the building switch level. When the office next door starts a large file transfer and your VoIP quality drops, the only evidence in your system might be a sudden spike in user complaints. Your internal switches will show clean queues because the congestion is happening upstream of your equipment.
Cultural hesitancy to report. In some Philippine workplace cultures, employees are reluctant to file complaints or trouble tickets because they don’t want to be seen as causing problems. Framing the feedback form as “Call Quality Report” rather than “Complaint” and positioning it as a contribution to system improvement rather than a criticism of IT can increase adoption significantly.
For organizations that need help designing these feedback systems and integrating them with existing network monitoring infrastructure, you can reach out to discuss your requirements with Kital for guidance on call quality feedback systems tailored to Philippine enterprise environments.
Where Feedback-Driven Diagnostics Still Fall Short
User feedback as a VoIP diagnostic engine has real limitations that are worth being honest about.
Users can’t report problems they don’t perceive. Slight jitter that degrades MOS from 4.3 to 3.8 might not register as a noticeable issue to most users but still indicates a network condition that will worsen under load. And users can’t report problems on calls where the other party experiences the degradation but they don’t, which is common in asymmetric packet loss scenarios. Your network logging and proactive monitoring infrastructure still needs to catch what users can’t feel.
There’s also a signal-to-noise problem. In a 500-seat BPO operation, you’ll get complaints that stem from user error (muted microphone, headset not plugged in, wrong audio device selected in the softclient) mixed in with legitimate network issues. Your structured form helps filter these, but it doesn’t eliminate them. You’ll still need tier-1 support to triage before the data enters your diagnostic pipeline.
And feedback-driven diagnostics are inherently reactive. They tell you where problems exist after users have already been affected. Combining them with synthetic monitoring, continuous benchmarking, and capacity planning is what builds a complete VoIP troubleshooting practice. The user feedback layer fills the gaps that automated tools leave, but it doesn’t replace those tools. The strongest diagnostic posture uses both streams together, validating each against the other, and accepting that neither one alone gives you the full picture of what’s happening on your network.