SIP INVITE messages, RTP jitter statistics, DSCP markings, syslog timestamps: a single VoIP call touches at least four layers of your network stack, and each layer keeps its own version of events. When call quality collapses in a Philippine enterprise, the instinct is to blame the ISP. Sometimes the ISP deserves it. But the logs, when you actually read them in sequence, often point somewhere else entirely: a misconfigured QoS policy, a switch port flapping every 90 seconds, or a firewall silently mangling SIP packets through an overzealous Application Layer Gateway. VoIP network logging, done correctly, is the mechanism that catches these failures before a single dropped call on one floor turns into a site-wide outage that takes your BPO operations offline.
The misunderstanding most Philippine IT teams carry is that logging means turning on syslog, pointing it at a server, and searching it after something breaks. That reactive approach guarantees you’ll always be one incident behind. The actual mechanism worth understanding here is full-stack monitoring: collecting, correlating, and alerting on logs from every layer of the call path in near real-time, so you can see a problem forming and kill it before it cascades.
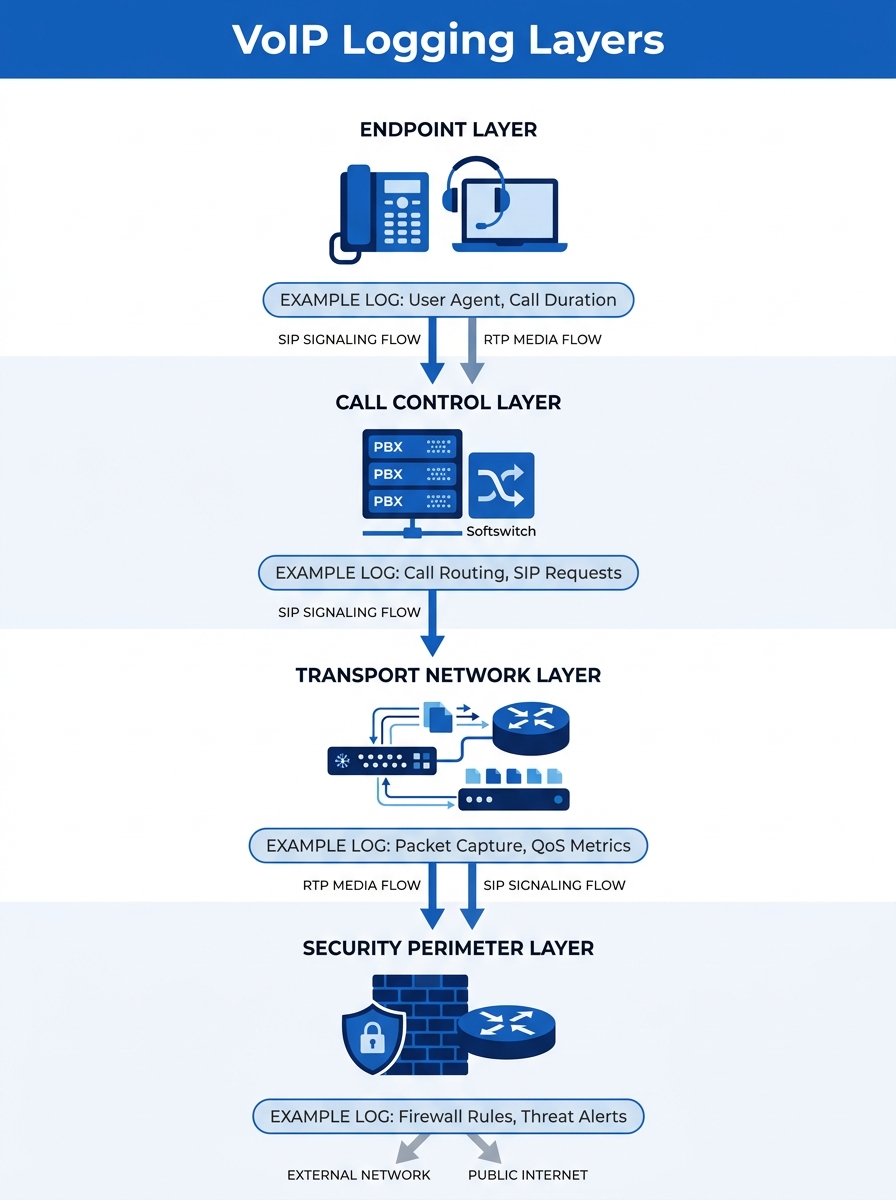
The Four Layers That Generate Useful Data
A VoIP call traverses a predictable stack, and each layer produces different evidence. Understanding what each layer records is the foundation of any serious network troubleshooting methodology.
Endpoints come first. Yeastar IP PBXs, Fanvil desk phones, Jabra headsets connected to softphones — each generates registration logs, codec negotiation records, and sometimes local jitter statistics. On a Fanvil X-series phone, the web interface exposes a real-time RTP statistics page showing packet loss percentage and jitter per active call. Most IT teams never look at this data unless a user physically complains.
Call control platforms sit above the endpoint layer. Your PBX or SBC (Session Border Controller) handles SIP signaling. Every INVITE, 100 Trying, 180 Ringing, 200 OK, and BYE message gets logged if you’ve enabled SIP debug or verbose logging. This is where you see registration failures, authentication errors, and the exact moment a call setup stalls.
The transport network carries the actual voice packets. Switches, routers, and wireless access points log port status changes, queue drops, interface error counters, and SNMP traps. A link flapping issue on a trunk port that cycles every 90 seconds will destroy call quality for an entire VLAN, and the switch log is the only place that evidence lives.
The security perimeter is the layer most teams forget about. Firewalls inspect and sometimes modify VoIP traffic. FortiGate appliances, for instance, have a dedicated VoIP profile that can log SIP and SCCP protocol events as they pass through the firewall. If your firewall’s SIP ALG is enabled and rewriting SIP headers incorrectly, one-way audio results. The firewall log will show the session being created, but only a packet trace will reveal the header rewrite itself.
SIP Signaling Logs and What They Expose
SIP is a text-based protocol, which makes its logs surprisingly readable once you know what to look for. A healthy call produces a clean ladder diagram: INVITE → 100 Trying → 180 Ringing → 200 OK → ACK → (media flows) → BYE → 200 OK. Deviations from this pattern tell you exactly where something went wrong.
A 408 Request Timeout on the INVITE means the destination phone never responded. This could be a dead phone, a VLAN misconfiguration, or a firewall blocking the SIP port. A 403 Forbidden means the PBX rejected the caller’s credentials. A 486 Busy Here is normal; fifty of them in a row from the same extension suggests a call loop or a misconfigured hunt group.
The detail that matters for call quality root cause analysis is timing. SIP logs timestamp every message. If there’s a 3-second gap between the INVITE and the 100 Trying, your PBX is overloaded or your DNS resolution for the SIP domain is failing. If the gap appears between 200 OK and the first RTP packet, your firewall or NAT device is struggling to open the media port.
We’ve explored when to use packet traces versus system logs for different diagnostic scenarios in a separate piece. The short version here: SIP logs tell you what happened during call setup and teardown. For everything that happens during the actual conversation, you need RTP data.
RTP Stream Analysis and Packet Trace Diagnostics
RTP (Real-time Transport Protocol) carries the actual voice audio. Each RTP packet includes a sequence number and a timestamp, which means the receiving device can calculate exactly how many packets arrived late, out of order, or not at all.
The key metrics are:
- Jitter: the variation in packet arrival times. For acceptable call quality, jitter should stay below 30 milliseconds. Philippine domestic connections on fiber typically deliver under 20ms according to broadband performance data, but wireless last-mile segments and congested switches can push this much higher.
- Packet loss: anything above 1% starts producing audible artifacts — clicks, gaps, robotic-sounding speech. At 5%, the call becomes unusable.
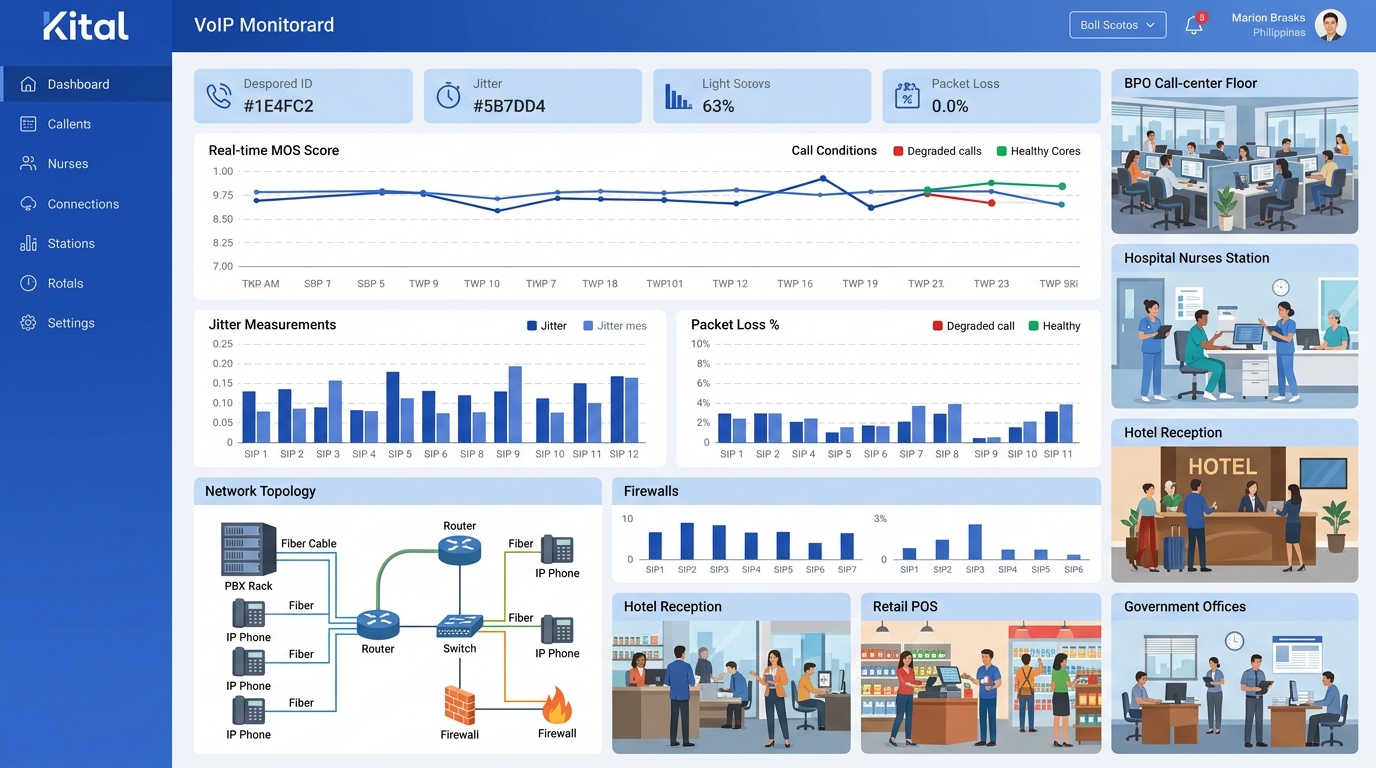
- MOS (Mean Opinion Score): a calculated score from 1.0 to 5.0 that combines jitter, loss, and latency into a single quality number. Enterprise VoIP targets are usually 4.0 or above.
Tools like SolarWinds VoIP Monitor and VoIPmonitor can calculate these metrics continuously from mirrored traffic or RTCP (RTP Control Protocol) reports. VoIPmonitor in particular tracks ACD (Average Call Duration), ASR (Answer Seizure Ratio), and NER (Network Effectiveness Ratio), giving you fleet-wide visibility into whether call quality is degrading across your entire deployment or isolated to specific trunks.
Packet trace diagnostics go deeper. A Wireshark capture on a mirrored port lets you inspect individual RTP streams, decode the audio codec, and visually graph jitter over the duration of a call. This level of analysis is usually reserved for persistent, hard-to-reproduce issues where aggregate metrics don’t tell the whole story.
The logs from any single device will give you a hypothesis. Only correlated logs from multiple layers will give you the actual root cause.
Infrastructure Logs: The Evidence That Gets Buried
Switches and routers generate enormous volumes of log data. The useful VoIP evidence hides inside interface counters and QoS queue statistics, and default dashboards rarely surface it.
On a Cisco Catalyst switch, the command that matters most is showing interface counters for input errors, output drops, and CRC errors. Output drops on a port carrying VoIP traffic mean the egress queue overflowed — packets were literally discarded because the queue was full. If your QoS configuration isn’t prioritizing voice traffic into the strict priority queue (typically mapped to DSCP EF / PHB 46), voice packets compete with bulk data transfers and lose.
For organizations running Fortinet security solutions at the perimeter, FortiGate’s VoIP-specific application control profiles add another logging dimension. These profiles can detect and log SIP protocol violations, rate-limit SIP registrations to prevent toll fraud scanning, and record whether the firewall’s SIP ALG modified any headers during transit. Disabling SIP ALG is one of the most common fixes for one-way audio problems, but you won’t know it’s the culprit unless the log shows the header rewrite happening.
WAN edge congestion is another frequent offender in Philippine enterprise networks. When your 50 Mbps MPLS link to a provincial branch is saturated by a large file transfer, VoIP packets queue behind data packets unless strict priority queuing is in place. The router’s interface queue statistics will show this clearly, but only if you’re collecting and reviewing them before users start calling the helpdesk.
Correlating Timestamps Across the Stack
Here’s where VoIP network logging becomes genuinely powerful. Individual device logs produce hypotheses. Correlated logs across layers produce confirmed root causes.
The process works like this: an agent on your BPO floor reports choppy audio on outbound calls between 2:00 PM and 3:00 PM daily. You pull the PBX’s SIP logs for that window and confirm that RTP statistics show elevated jitter on calls routed through Trunk Group 2. You check the switch port connected to the SBC and find output queue drops spiking during the same window. You check the router’s WAN interface and discover a scheduled backup job that saturates the MPLS link every day at 2:00 PM.
Root cause confirmed: the backup job is consuming bandwidth that should be reserved for voice. The fix is either rescheduling the backup, implementing proper QoS with a priority queue for DSCP EF traffic, or provisioning more bandwidth on that link.
Without correlated timestamps, each team points fingers. The PBX admin says the trunks are fine. The network team says the WAN link isn’t at capacity (because they’re looking at 15-minute averages, not per-second peaks). The ISP says latency to their edge is within SLA. Everyone is technically correct, and nobody finds the problem.
Full-stack monitoring tools solve this by ingesting logs from all four layers and displaying them on a unified timeline. Oracle’s Enterprise Operations Monitor, for example, correlates calls across multiple sites and protocols into a single view. For smaller deployments, even a properly configured syslog server with NTP-synchronized timestamps and good search tools gets you 80% of the way there. Organizations that centralize their voice infrastructure in enterprise data center facilities gain an advantage here because log collection, storage, and analysis can share the same physical network, eliminating transport delays in the monitoring pipeline itself.
Tip: NTP synchronization across all devices is non-negotiable. If your PBX clock drifts by 30 seconds from your firewall clock, your log correlation falls apart. Configure a single NTP source for every device in the call path.
Testing Before Trouble Arrives
Reactive logging waits for users to complain. Proactive testing catches degradation before anyone notices. As Cebod Telecom’s troubleshooting guide outlines, regular testing should include three categories: simulated calls to measure quality under real conditions, bandwidth tests to verify available capacity, and security scans to identify exposed SIP endpoints.
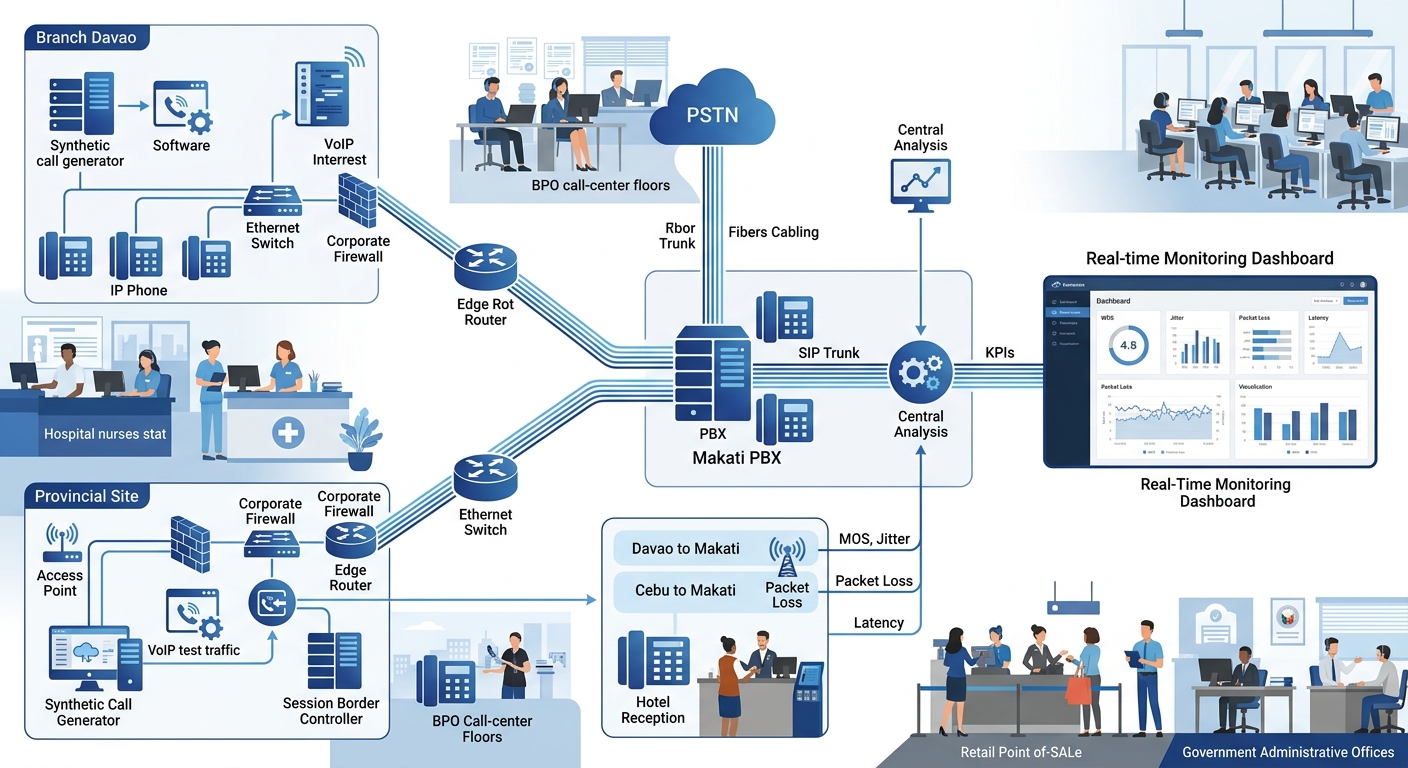
Simulated call testing is particularly valuable for Philippine enterprises with provincial branches. A synthetic SIP call placed every five minutes from your Davao office to your Makati PBX generates continuous MOS data without requiring a human to pick up the phone. When the MOS score drops below 3.8, your monitoring platform fires an alert, and your network team investigates before any real caller experiences the problem.
From each branch back to the central PBX, synthetic monitoring creates a heat map of link quality across the entire WAN. You can see which branches are experiencing degradation, correlate that with ISP performance data, and escalate to the correct carrier with specific evidence instead of a vague “calls sound bad” ticket. That specificity changes the ISP conversation entirely, because you’re presenting timestamped MOS scores and jitter measurements, not anecdotes.
Where This Methodology Falls Apart
Correlated, multi-layer VoIP logging works well when your network is under your control. It breaks down in several predictable ways.
Carrier-side problems are a black box. When the issue lives inside PLDT’s or Globe’s backbone, your logs show clean handoff at the WAN edge and degraded quality at the far end. You can prove the problem isn’t yours, but you can’t diagnose it further. The best you can do is present continuous trace data to the ISP as timestamped evidence of degradation on their side of the handoff.
Log volume overwhelms small teams. A 200-seat BPO operation generating 5,000 calls per day produces millions of log entries across all four layers. Without automated alerting and threshold-based filtering, a two-person IT team will never review this data proactively. They’ll use it forensically after an incident, which is better than nothing but misses the early-warning promise.
Encryption blinds packet inspection. As more VoIP deployments adopt SRTP (encrypted RTP) and TLS-encrypted SIP, deep packet inspection of voice traffic becomes impossible without decryption keys. You can still monitor metadata — call setup times, duration, packet counts — but you lose the ability to inspect codec behavior or detect specific header anomalies inside encrypted sessions.
Philippine power and connectivity instability adds noise. Rolling brownouts in provincial areas cause brief switch reboots that generate flurries of log entries: port up/down events, STP recalculations, SIP re-registrations. Filtering this environmental noise from genuine configuration problems requires careful baseline establishment and alert tuning specific to each site’s conditions. A network-first approach to VoIP infrastructure design helps by building resilience into the architecture itself, so fewer environmental events cascade into service-affecting incidents that clutter the logs.
This methodology can’t replace good network design. It can’t compensate for under-provisioned bandwidth, misconfigured VLANs, or the decision to run voice traffic over a congested flat network. What it can do is make failures visible, traceable, and fixable before a single dropped call on one floor becomes a P1 incident that takes your contact center offline for an hour. That tradeoff — operational discipline in exchange for early warning — is where the real value of the mechanism lives.