VoIP regression testing runs synthetic calls at fixed intervals, compares the resulting jitter, latency, packet loss, and MOS scores against stored per-site baselines, and fires tiered alerts the moment a metric drifts past threshold. This closed-loop mechanism replaces one-time commissioning checks with continuous validation that catches quality degradation before end users notice.
TL;DR: Automated call quality regression testing works by scheduling synthetic VoIP calls every 5–15 minutes, recording four core metrics per call, comparing each reading against a site-specific baseline, and routing alerts through a three-tier escalation model. Philippine enterprises need per-site baselines because a Makati office and a Davao branch operate on fundamentally different ISP infrastructure.
The Reference-Signal Workflow Behind Synthetic Calls
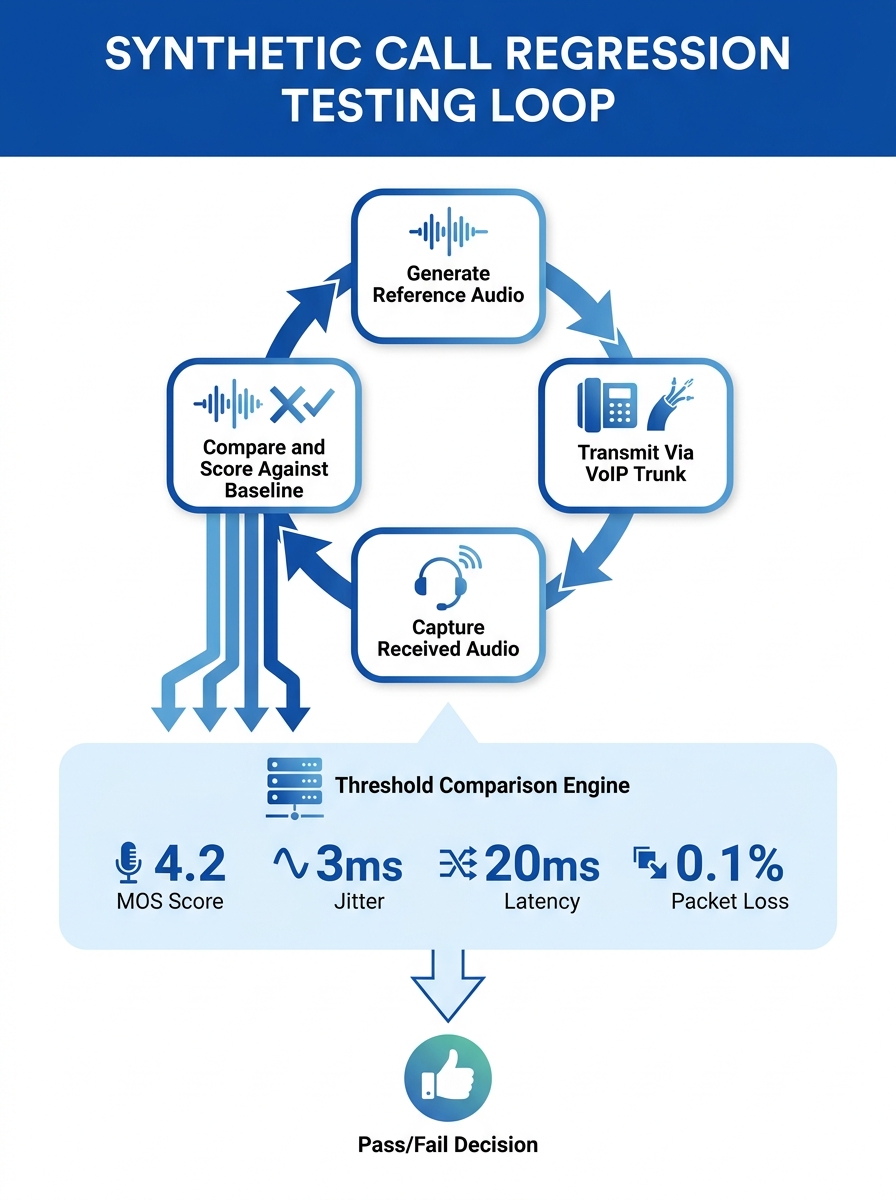
The engine driving regression testing is a reference-signal comparison. A synthetic call generator sends a known audio sample from point A to point B, records the received audio, and scores the difference. TestMu AI’s 2026 voice quality testing guide describes the core method: “VoIP and IVR use a reference-signal workflow comparing clean and received audio.” The gap between what was sent and what arrived produces objective, repeatable measurements.
Each synthetic call captures four data points: one-way latency in milliseconds, jitter in milliseconds, packet loss as a percentage, and a calculated MOS (Mean Opinion Score) on a 1-to-5 scale. These four numbers become a time-stamped row in a database. Run enough synthetic calls over enough days, and you build a statistical baseline for each site, each trunk, and each time window.
Scheduling matters. During business hours (typically 8 AM to 8 PM for BPO operations, 8 AM to 5 PM for corporate offices), synthetic calls should fire every 5 to 15 minutes. Off-peak windows can stretch to every 30 minutes. This cadence balances measurement density against trunk consumption, since each synthetic call occupies a real channel for 10–30 seconds.
The critical distinction here: synthetic calls test infrastructure health independently of whether anyone is making a real phone call at that moment. A trunk path can degrade at 3 AM due to ISP re-routing and nobody would know until the morning rush produces garbled audio. Synthetic calls running at 3:30 AM catch that drift 5 hours before the first complaint.
Four Metrics That Trigger a Regression Alert
Why these four specific metrics, and what values constitute a regression event? Each one captures a different failure mode in the voice path.
One-way latency measures how long a packet takes to travel from sender to receiver. The regression threshold sits at 150 ms for G.711 codec deployments. Philippine enterprises running trunks between Metro Manila and Visayas/Mindanao offices frequently see 80–120 ms under normal conditions. When latency climbs past 150 ms, conversational overlap begins. Users talk over each other because the audio delay exceeds the tolerance of natural turn-taking.
Jitter measures the variation between packet arrival times. A threshold of 30 ms separates acceptable from degraded. Jitter buffers on most Yeastar and Cisco IP phones absorb up to 20–30 ms of variation, but beyond that point, the buffer either overflows (clipping audio) or must be enlarged (adding latency). Three consecutive 5-minute measurement intervals showing jitter above 30 ms should trigger a regression alert.
Packet loss is the percentage of audio packets that never arrive. For G.711 at 64 kbps, the threshold is 1%. G.729 deployments, common in bandwidth-constrained Philippine networks, tolerate even less because the codec’s compression algorithm can’t gracefully conceal missing frames. At 1% packet loss, listeners hear intermittent clicks and syllable drops. At 3%, entire words vanish.
MOS (Mean Opinion Score) combines the effects of all three metrics into a single 1-to-5 quality score. A MOS of 4.0 or higher represents toll-quality voice. Below 3.5, users start filing tickets. Below 3.0, calls become functionally unusable for business communication. MOS is calculated algorithmically by the synthetic test tool using the ITU-T P.862 (PESQ) or P.863 (POLQA) standards, removing the need for human listening panels.
| Metric | Acceptable Range | Warning Threshold | Critical Threshold | Typical Philippine Urban Baseline |
|---|---|---|---|---|
| One-way latency | < 100 ms | 100–150 ms | > 150 ms | 40–80 ms (Metro Manila intra-city) |
| Jitter | < 20 ms | 20–30 ms | > 30 ms | 5–15 ms (fiber connections) |
| Packet loss | < 0.5% | 0.5–1% | > 1% | 0.1–0.3% (dedicated MPLS) |
| MOS | > 4.0 | 3.5–4.0 | < 3.5 | 4.1–4.3 (well-configured G.711) |
I propose calling this the JLPM Regression Gate (Jitter, Latency, Packet loss, MOS). A regression event fires when any single metric breaches its warning threshold for 3 consecutive intervals, or when any metric breaches its critical threshold for 1 interval. Both conditions should generate alerts, but at different escalation tiers.
Per-Site Baselines Across the Philippine Archipelago
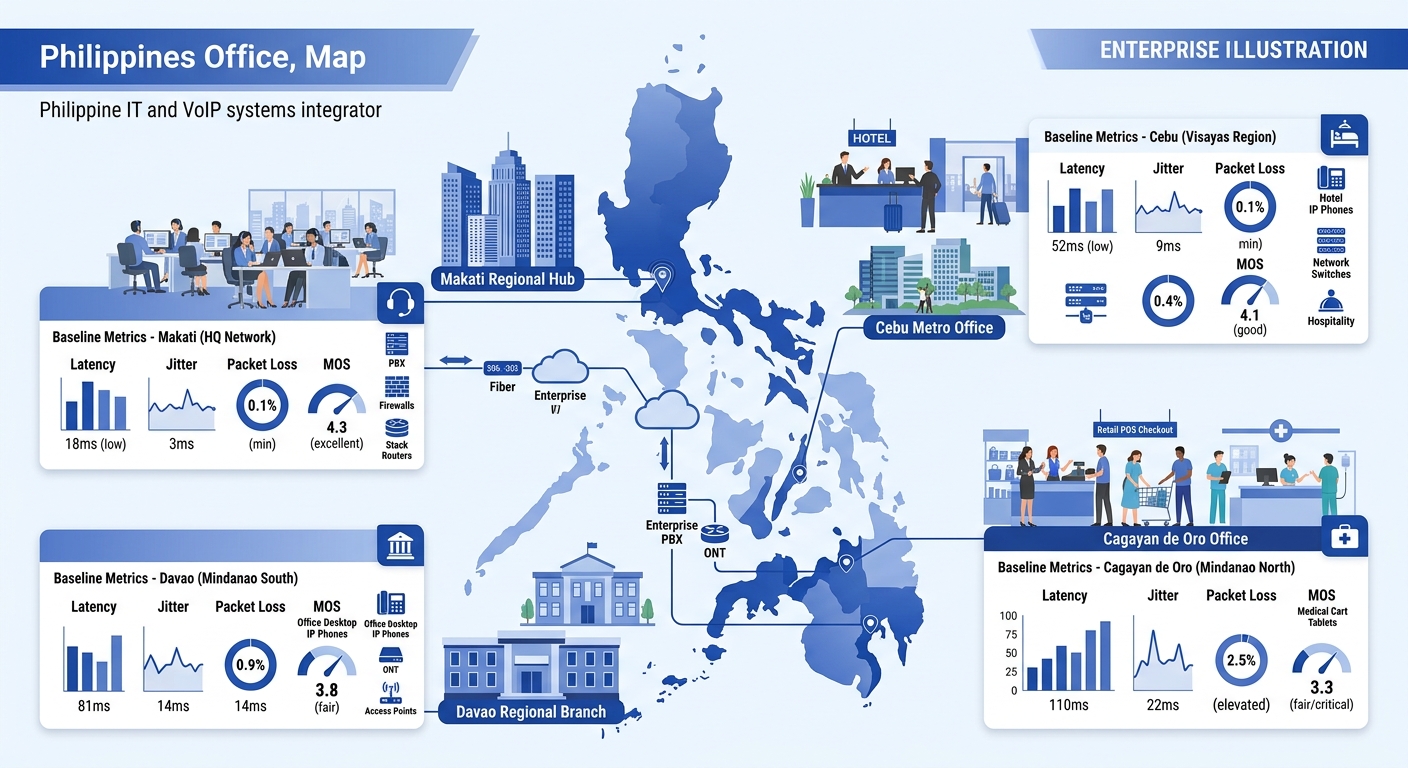
Applying a single set of thresholds across all sites produces either excessive false alerts in provincial locations or dangerously loose tolerance in Metro Manila. Philippine enterprise VoIP validation demands per-site baseline calibration because ISP infrastructure varies dramatically between regions.
A Makati CBD office on a PLDT fiber connection with a dedicated MPLS circuit might baseline at 45 ms latency, 8 ms jitter, 0.1% packet loss, and MOS 4.3. A branch office in Cagayan de Oro running on a Globe LTE backup link might baseline at 110 ms latency, 22 ms jitter, 0.8% packet loss, and MOS 3.8. If you apply the Makati thresholds to Cagayan de Oro, the alert system pages your NOC team every 15 minutes over conditions that are normal for that site.
Baseline calibration requires a 2-week burn-in period per site. During those 14 days, the synthetic call system runs at full cadence without alerting enabled. It collects enough data points to calculate per-metric averages, standard deviations, and time-of-day patterns. The regression threshold for each site is then set at 2 standard deviations above its own baseline mean, with the hard ceiling never exceeding the critical thresholds from the JLPM Regression Gate.
This per-site approach also catches slow degradation that a global threshold would miss. If a Cebu branch normally runs at MOS 4.1 and gradually drifts to MOS 3.7 over three weeks due to a failing last-mile connection, the per-site regression gate triggers even though 3.7 still clears the global “critical” line of 3.5. The degradation is real relative to that site’s capability, and it signals an infrastructure problem that will get worse.
Philippine financial institutions with branch networks spanning 15–50 locations across Luzon, Visayas, and Mindanao have the most to gain from per-site baselining, because their branches sit on wildly different ISP circuits and their regulatory requirements for recorded call quality make silent degradation a compliance risk.
Tiered Escalation Logic for Alert Thresholds
Not every threshold breach warrants a phone call to your network engineer at 2 AM. The OneUptime alert threshold design guide frames this well: alerts should be classified into tiers so that low-severity drift gets logged, moderate regression gets notified during business hours, and critical failures page someone immediately.
A three-tier escalation model works well for VoIP regression:
Tier 1 — Log only. A single metric breaches its warning threshold for 1–2 intervals. The event gets recorded in the monitoring dashboard and included in the daily summary report. Nobody gets pinged. This captures transient spikes caused by brief ISP congestion, firmware update cycles, or phantom deregistration events that resolve on their own.
Tier 2 — Notify during business hours. A single metric stays above its warning threshold for 3+ consecutive intervals, or MOS drops below 3.8 for 2+ intervals. The system sends a Slack message, email, or Teams notification to the network operations channel. The NOC investigates during business hours. About 60–70% of regression events fall into this tier, and most are traceable to ISP routing changes, QoS misconfiguration after a switch firmware update, or bandwidth saturation from unthrottled file transfers. If your team has already built a root-cause analysis toolkit, Tier 2 events are where that toolkit gets its daily exercise.
Tier 3 — Page immediately. Any metric breaches its critical threshold (latency above 150 ms, jitter above 30 ms, packet loss above 1%, MOS below 3.5) for 1 or more intervals. The system sends an SMS, PagerDuty alert, or auto-dial to the on-call engineer. Tier 3 events represent active service degradation that callers can hear. BPO operations running 500+ concurrent seats lose revenue in minutes when MOS drops below 3.5, because customer satisfaction scores collapse and agent handle times spike as both parties ask each other to repeat sentences.
CloudTalk’s call center quality management research recommends the same principle: “Automatically flag calls that fall below quality thresholds so managers can review and address them quickly.” The automation removes human polling lag from the detection loop.
Warning: Alert fatigue kills monitoring programs. If your Tier 2 channel fires more than 10 alerts per day per site, your thresholds are too tight or your baselines need recalibration. The 2-week burn-in exists specifically to prevent this.
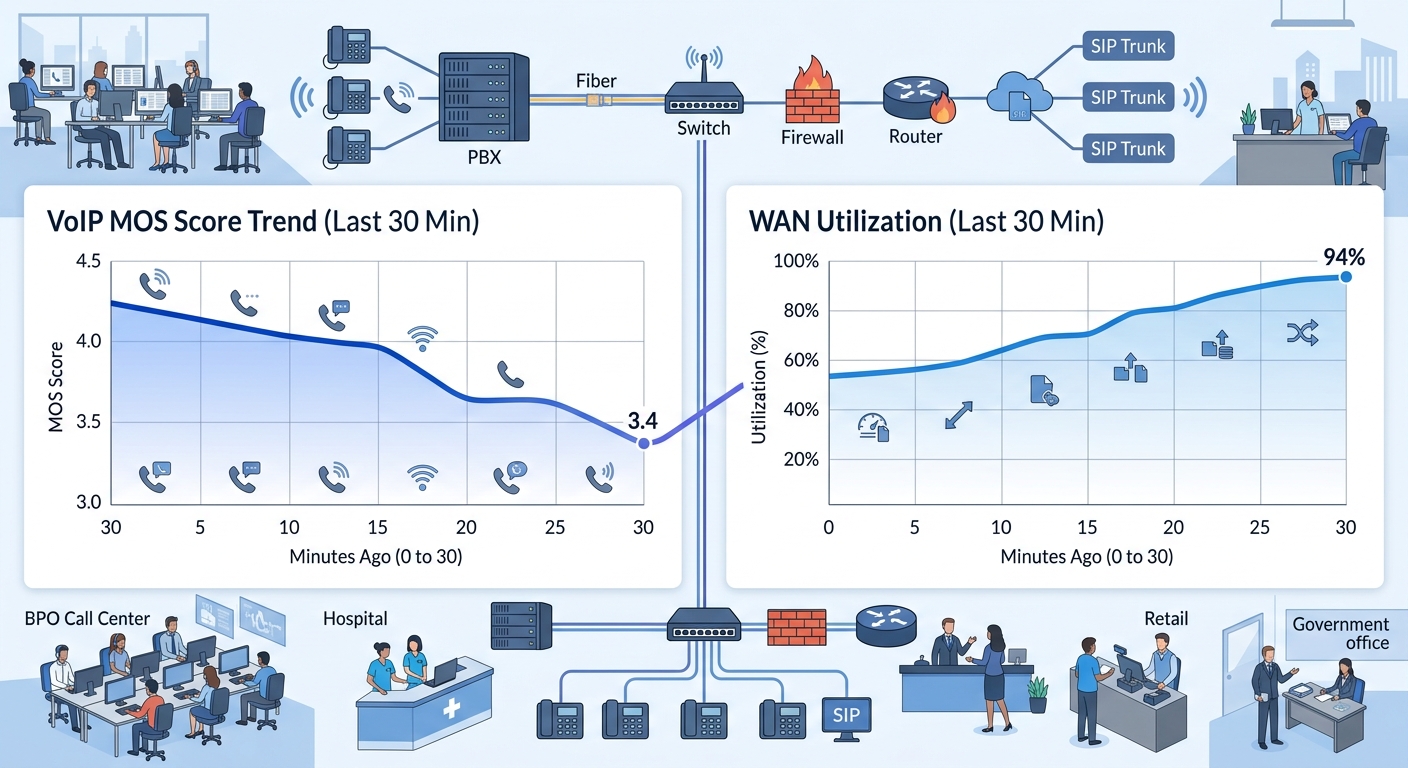
Correlating WAN Performance With Call Quality Data
VoIP regression data becomes significantly more useful when you overlay it with WAN telemetry from your routers, firewalls, and SD-WAN controllers. A MOS drop from 4.2 to 3.6 tells you something is wrong. Correlating that drop with a simultaneous 40% spike in WAN utilization on the same circuit tells you exactly what went wrong.
Philippine enterprise networks that span multiple ISP interconnections face a specific blind spot: neither Globe nor PLDT monitors call quality across the other’s network. When your Davao office on Globe calls your Makati PBX on PLDT, the voice path crosses an interconnection boundary that neither ISP instruments. Your regression testing framework is the only system watching that cross-carrier path end-to-end.
Tools like SolarWinds VoIP & Network Quality Manager (VNQM), Cisco IP SLA responders, and PRTG Network Monitor can poll router interfaces for bandwidth utilization, error counts, and CRC failures every 60 seconds. When a Tier 2 or Tier 3 VoIP regression alert fires, the NOC’s first action is pulling the WAN utilization graph for the affected site during the same time window. Philippine monitoring providers such as Infocentric, which partners with SolarWinds, offer managed monitoring services that provide this correlation out of the box.
If your network already has QoS policies marking VoIP traffic as DSCP EF (Expedited Forwarding), a regression event that occurs while WAN utilization is below 60% points to a different problem than one that occurs at 95% utilization. Below 60%, the cause is likely ISP-side: routing changes, peering congestion, or packet reordering. Above 90%, the cause is likely local: somebody saturating the pipe with a backup job, a video conference consuming bandwidth, or a misconfigured QoS policy that isn’t actually prioritizing voice packets.
Where the Model Breaks
The JLPM Regression Gate and tiered alerting model cover the majority of VoIP performance benchmarking scenarios, but the framework has real limitations that you should understand before deploying it.
Synthetic calls don’t reproduce codec switching behavior. If your PBX is configured to fall back from G.711 to G.729 under congestion, synthetic calls pinned to a single codec won’t catch the quality impact of that fallback. You need separate synthetic test profiles for each codec in your dial plan, which doubles or triples your trunk channel consumption for testing.
One-way latency measurement requires NTP synchronization. Both endpoints of the synthetic call must sync to the same time source with sub-millisecond accuracy. Philippine enterprise environments frequently have branch office NTP configurations pointing to different upstream servers with 10–50 ms of clock drift between them. That drift gets added to your latency measurement, producing false regression alerts. Before trusting latency data, confirm all synthetic call endpoints are syncing to the same stratum-2 or stratum-3 NTP source.
The model doesn’t detect audio-layer problems that don’t affect network metrics. Echo, acoustic feedback, and handset speaker distortion all produce terrible call quality with perfect MOS scores, because the network delivered the packets faithfully. These failures require packet-level audio analysis at the endpoint, which is a different layer of testing entirely.
Cross-carrier path variability defeats static baselines during peering disputes. Philippine ISP interconnection quality fluctuates based on commercial relationships between carriers. When Globe and PLDT renegotiate peering terms, the latency on cross-carrier paths can shift by 20–40 ms for weeks before stabilizing. Your per-site baselines won’t adapt fast enough unless you implement rolling baseline recalculation with a 7-day lookback window that allows the baseline to drift upward during these periods and recover afterward.
Your regression testing framework is the only system watching the cross-carrier voice path end to end, because neither ISP instruments the other’s network.
Network performance monitoring threshold alerts are the backbone of this framework, but they demand maintenance. Baselines go stale. ISP circuits get upgraded. New offices come online. Every site addition or circuit change should trigger a fresh 2-week burn-in period for that location. The organizations that sustain this discipline catch degradation trends over weeks. The ones that deploy it and forget about it end up with an alert system that either cries wolf constantly or stays silent during genuine failures, and both outcomes erode trust in the monitoring program until someone eventually disables it.